Important differences between apple pie and popovers Apple pie has less folate, vitamin B1, manganese, iron, vitamin B3, copper, phosphorus, and vitamin B5. Popovers' daily need coverage for folate is 35% more. Apple pie has 4 times more saturated fat than popovers. Apple pie has 3.797g of saturated fat, while popovers have 0.983g. The food varieties used in the comparison are Pie, apple, commercially prepared, unenriched flour and Popovers, dry mix, enriched .
Infographic
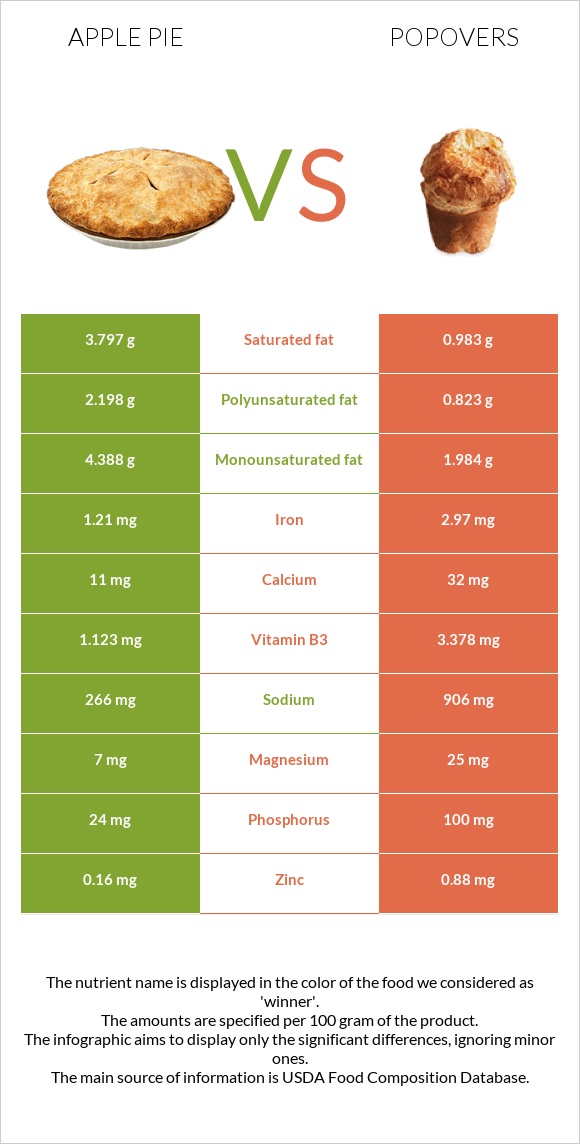
Mineral Comparison
Mineral comparison score is based on the number of minerals by which one or the other food is richer. The "coverage" charts below show how much of the daily needs can be covered by 300 grams of the food.
1
100 g
300 g
1 oz - 28.35g 1 piece (1/6 of 8" pie) - 117g 1 piece (1/8 of 9" dia) - 125g
Magnesium
Magnesium
Calcium
Calcium
Potassium
Potassium
Iron
Iron
Copper
Copper
Zinc
Zinc
Phosphorus
Phosphorus
Sodium
Sodium
Manganese
Manganese
Selenium
Selenium
5%
3.3%
5.7%
45%
15%
4.4%
10%
35%
24%
0%
9
100 g
300 g
1 oz - 28.35g 1 package (6 oz) - 170g
Magnesium
Magnesium
Calcium
Calcium
Potassium
Potassium
Iron
Iron
Copper
Copper
Zinc
Zinc
Phosphorus
Phosphorus
Sodium
Sodium
Manganese
Manganese
Selenium
Selenium
18%
9.6%
8.8%
111%
57%
24%
43%
118%
97%
205%
Vitamin Comparison
Vitamin comparison score is based on the number of vitamins by which one or the other food is richer. The "coverage" charts below show how much of the daily needs can be covered by 300 grams of the food.
2
100 g
300 g
1 oz - 28.35g 1 piece (1/6 of 8" pie) - 117g 1 piece (1/8 of 9" dia) - 125g
Vitamin C
Vit. C
Vitamin D
Vit. D
Vitamin A
Vit. A
Vitamin E
Vit. E
Vitamin B1
Vit. B1
Vitamin B2
Vit. B2
Vitamin B3
Vit. B3
Vitamin B5
Vit. B5
Vitamin B6
Vit. B6
Vitamin B12
Vit. B12
Vitamin K
Vit. K
Folate
Folate
11%
0%
9.7%
0%
34%
36%
21%
7.1%
8.8%
1.3%
0%
3%
6
100 g
300 g
1 oz - 28.35g 1 package (6 oz) - 170g
Vitamin C
Vit. C
Vitamin D
Vit. D
Vitamin A
Vit. A
Vitamin E
Vit. E
Vitamin B1
Vit. B1
Vitamin B2
Vit. B2
Vitamin B3
Vit. B3
Vitamin B5
Vit. B5
Vitamin B6
Vit. B6
Vitamin B12
Vit. B12
Vitamin K
Vit. K
Folate
Folate
0.33%
0%
0%
0%
108%
34%
63%
29%
9.7%
10%
0%
109%
All nutrients comparison - raw data values
Nutrient
DV% diff.
Selenium
37.6µg
68%
Folate
4µg
145µg
35%
Sodium
266mg
906mg
28%
Vitamin B1
0.134mg
0.43mg
25%
Manganese
0.182mg
0.741mg
24%
Iron
1.21mg
2.97mg
22%
Protein
1.9g
10.4g
17%
Copper
0.046mg
0.171mg
14%
Vitamin B3
1.123mg
3.378mg
14%
Saturated fat
3.797g
0.983g
13%
Carbs
34g
71g
12%
Phosphorus
24mg
100mg
11%
Fats
11g
4.3g
10%
Polyunsaturated fat
2.198g
0.823g
9%
Calories
237kcal
371kcal
7%
Zinc
0.16mg
0.88mg
7%
Vitamin B5
0.119mg
0.48mg
7%
Fiber
1.6g
6%
Monounsaturated fat
4.388g
1.984g
6%
Magnesium
7mg
25mg
4%
Vitamin C
3.2mg
0.1mg
3%
Vitamin A
29µg
0µg
3%
Vitamin B12
0.01µg
0.08µg
3%
Calcium
11mg
32mg
2%
Potassium
65mg
100mg
1%
Vitamin B2
0.158mg
0.147mg
1%
Protein per 100 calories
0.8g
2.8g
N/A
Calories per 10 g protein
1247kcal
357kcal
N/A
Weight per 100 calories
42g
27g
N/A
Unsaturated / Saturated Fat ratio
1.7
2.9
N/A
Net carbs
32.4g
71g
N/A
Vitamin B6
0.038mg
0.042mg
0%
Tryptophan
0.026mg
0.123mg
0%
Threonine
0.054mg
0.293mg
0%
Isoleucine
0.073mg
0.407mg
0%
Leucine
0.129mg
0.747mg
0%
Lysine
0.07mg
0.249mg
0%
Methionine
0.032mg
0.191mg
0%
Phenylalanine
0.088mg
0.517mg
0%
Valine
0.084mg
0.458mg
0%
Histidine
0.038mg
0.229mg
0%
Macronutrient Comparison
Macronutrient breakdown side-by-side comparison
2
2%
11%
34%
52%
Protein:
1.9 g
Fats:
11 g
Carbs:
34 g
Water:
52.2 g
Other:
0.9 g
3
10%
4%
71%
12%
3%
Protein:
10.4 g
Fats:
4.3 g
Carbs:
71 g
Water:
11.7 g
Other:
2.6 g
Contains
more
Fats Fats
+155.8%
Contains
more
Water Water
+346.2%
Contains
more
Protein Protein
+447.4%
Contains
more
Carbs Carbs
+108.8%
Contains
more
Other Other
+188.9%
Fat Type Comparison
Fat type breakdown side-by-side comparison
2
37%
42%
21%
Saturated fat:
Sat. Fat
3.797 g
Monounsaturated fat:
Mono. Fat
4.388 g
Polyunsaturated fat:
Poly. Fat
2.198 g
1
26%
52%
22%
Saturated fat:
Sat. Fat
0.983 g
Monounsaturated fat:
Mono. Fat
1.984 g
Polyunsaturated fat:
Poly. Fat
0.823 g
Contains
more
Mono. Fat Monounsaturated fat
+121.2%
Contains
more
Poly. Fat Polyunsaturated fat
+167.1%
Contains
less
Sat. Fat Saturated fat
-74.1%