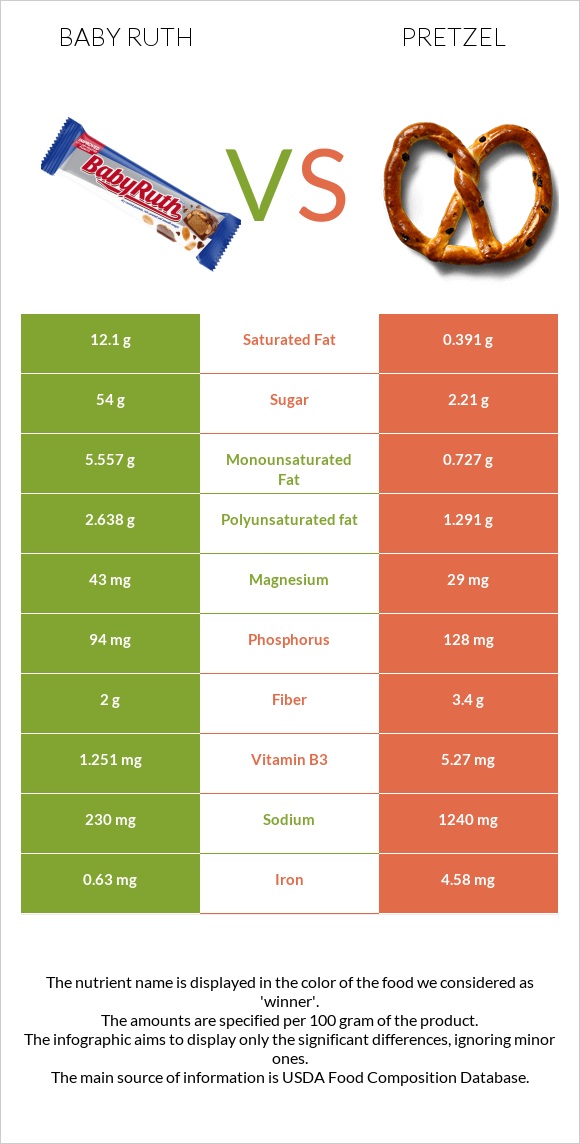
How are baby ruth and pretzel different? Baby ruth is richer in copper, while pretzel is higher in iron, folate, vitamin B1, manganese, vitamin B3, vitamin B2, and fiber. Baby ruth covers your daily need for saturated fat, 59% more than pretzel. Pretzel is lower in saturated fat. Candies, NESTLE, BABY RUTH Bar and Snacks, pretzels, hard, plain, salted types were used in this article.
Infographic
Mineral Comparison
Mineral comparison score is based on the number of minerals by which one or the other food is richer. The "coverage" charts below show how much of the daily needs can be covered by 300 grams of the food.
5
100 g
300 g
1 serving fun size bar 0.65 oz - 18g 1 serving 2.1 oz bar - 60g
Magnesium
Magnesium
Calcium
Calcium
Potassium
Potassium
Iron
Iron
Copper
Copper
Zinc
Zinc
Phosphorus
Phosphorus
Sodium
Sodium
Manganese
Manganese
Selenium
Selenium
31%
14%
22%
24%
75%
20%
40%
30%
46%
14%
5
100 g
300 g
1 oz - 28.35g 10 twists - 60g
Magnesium
Magnesium
Calcium
Calcium
Potassium
Potassium
Iron
Iron
Copper
Copper
Zinc
Zinc
Phosphorus
Phosphorus
Sodium
Sodium
Manganese
Manganese
Selenium
Selenium
21%
8.1%
20%
172%
52%
28%
55%
162%
132%
24%
Vitamin Comparison
Vitamin comparison score is based on the number of vitamins by which one or the other food is richer. The "coverage" charts below show how much of the daily needs can be covered by 300 grams of the food.
2
100 g
300 g
1 serving fun size bar 0.65 oz - 18g 1 serving 2.1 oz bar - 60g
Vitamin C
Vit. C
Vitamin D
Vit. D
Vitamin A
Vit. A
Vitamin E
Vit. E
Vitamin B1
Vit. B1
Vitamin B2
Vit. B2
Vitamin B3
Vit. B3
Vitamin B5
Vit. B5
Vitamin B6
Vit. B6
Vitamin B12
Vit. B12
Vitamin K
Vit. K
Folate
Folate
0%
0%
0%
19%
15%
28%
23%
20%
9.7%
7.5%
5.8%
9%
7
100 g
300 g
1 oz - 28.35g 10 twists - 60g
Vitamin C
Vit. C
Vitamin D
Vit. D
Vitamin A
Vit. A
Vitamin E
Vit. E
Vitamin B1
Vit. B1
Vitamin B2
Vit. B2
Vitamin B3
Vit. B3
Vitamin B5
Vit. B5
Vitamin B6
Vit. B6
Vitamin B12
Vit. B12
Vitamin K
Vit. K
Folate
Folate
7%
0%
0%
9.4%
106%
77%
99%
19%
17%
0%
7%
125%
All nutrients comparison - raw data values
Nutrient
DV% diff.
Saturated fat
12.1g
0.391g
53%
Iron
0.63mg
4.58mg
49%
Sodium
230mg
1240mg
44%
Folate
12µg
166µg
39%
Vitamin B1
0.058mg
0.424mg
31%
Starch
72.58g
30%
Fats
21.6g
2.93g
29%
Manganese
0.351mg
1.015mg
29%
Vitamin B3
1.251mg
5.27mg
25%
Vitamin B2
0.121mg
0.332mg
16%
Monounsaturated fat
5.557g
0.727g
12%
Protein
5.4g
10.04g
9%
Polyunsaturated fat
2.638g
1.291g
9%
Copper
0.225mg
0.156mg
8%
Fiber
2g
3.4g
6%
Carbs
64.8g
80.39g
5%
Phosphorus
94mg
128mg
5%
Calories
459kcal
384kcal
4%
Magnesium
43mg
29mg
3%
Zinc
0.72mg
1.04mg
3%
Vitamin E
0.93mg
0.47mg
3%
Selenium
2.5µg
4.4µg
3%
Vitamin B12
0.06µg
0µg
3%
Vitamin C
0mg
2.1mg
2%
Calcium
47mg
27mg
2%
Vitamin B6
0.042mg
0.074mg
2%
Potassium
249mg
223mg
1%
Choline
34.9mg
29.5mg
1%
Caffeine
4mg
0mg
1%
Protein per 100 calories
1.2g
2.6g
N/A
Calories per 10 g protein
850kcal
382kcal
N/A
Weight per 100 calories
22g
26g
N/A
Unsaturated / Saturated Fat ratio
0.68
5.2
N/A
Net carbs
62.8g
76.99g
N/A
Sugar
54g
2.21g
N/A
Vitamin B5
0.333mg
0.322mg
0%
Vitamin K
2.3µg
2.8µg
0%
Trans fat
0.05g
0.004g
N/A
Tryptophan
0.097mg
0%
Threonine
0.25mg
0%
Isoleucine
0.407mg
0%
Leucine
0.757mg
0%
Lysine
0.257mg
0%
Methionine
0.177mg
0%
Phenylalanine
0.52mg
0%
Valine
0.48mg
0%
Histidine
0.22mg
0%
Fructose
0.31g
0%
Omega-3 - ALA
0.063g
N/A
Omega-6 - Gamma-linoleic acid
0.001g
N/A
Omega-6 - Linoleic acid
1.223g
N/A
Macronutrient Comparison
Macronutrient breakdown side-by-side comparison
2
5%
22%
65%
7%
Protein:
5.4 g
Fats:
21.6 g
Carbs:
64.8 g
Water:
6.99 g
Other:
1.21 g
3
10%
3%
80%
3%
4%
Protein:
10.04 g
Fats:
2.93 g
Carbs:
80.39 g
Water:
3.13 g
Other:
3.51 g
Contains
more
Fats Fats
+637.2%
Contains
more
Water Water
+123.3%
Contains
more
Protein Protein
+85.9%
Contains
more
Carbs Carbs
+24.1%
Contains
more
Other Other
+190.1%
Fat Type Comparison
Fat type breakdown side-by-side comparison
2
60%
27%
13%
Saturated fat:
Sat. Fat
12.1 g
Monounsaturated fat:
Mono. Fat
5.557 g
Polyunsaturated fat:
Poly. Fat
2.638 g
1
16%
30%
54%
Saturated fat:
Sat. Fat
0.391 g
Monounsaturated fat:
Mono. Fat
0.727 g
Polyunsaturated fat:
Poly. Fat
1.291 g
Contains
more
Mono. Fat Monounsaturated fat
+664.4%
Contains
more
Poly. Fat Polyunsaturated fat
+104.3%
Contains
less
Sat. Fat Saturated fat
-96.8%