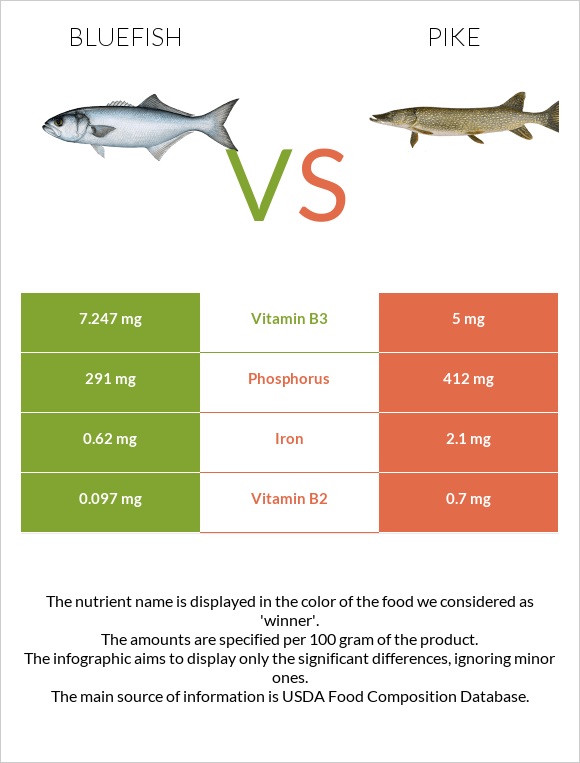
How are bluefish and pike different? Bluefish is higher in vitamin B3; however, pike is richer in vitamin B2, iron, phosphorus, and vitamin A. Daily need coverage for vitamin B2 for pike is 46% higher. Fish, bluefish, cooked, dry heat and Fish, pike, northern, liver (Alaska Native) are the varieties used in this article.
Infographic
Mineral Comparison
Mineral comparison score is based on the number of minerals by which one or the other food is richer. The "coverage" charts below show how much of the daily needs can be covered by 300 grams of the food.
6
100 g
300 g
3 oz - 85g 1 fillet - 117g
Magnesium
Magnesium
Calcium
Calcium
Potassium
Potassium
Iron
Iron
Copper
Copper
Zinc
Zinc
Phosphorus
Phosphorus
Sodium
Sodium
Manganese
Manganese
Selenium
Selenium
30%
2.7%
42%
23%
23%
28%
125%
10%
3.5%
255%
4
100 g
300 g
Magnesium
Magnesium
Calcium
Calcium
Potassium
Potassium
Iron
Iron
Copper
Copper
Zinc
Zinc
Phosphorus
Phosphorus
Sodium
Sodium
Manganese
Manganese
Selenium
Selenium
0%
8.4%
0%
79%
0%
0%
177%
0%
0%
0%
Vitamin Comparison
Vitamin comparison score is based on the number of vitamins by which one or the other food is richer. The "coverage" charts below show how much of the daily needs can be covered by 300 grams of the food.
6
100 g
300 g
3 oz - 85g 1 fillet - 117g
Vitamin C
Vit. C
Vitamin D
Vit. D
Vitamin A
Vit. A
Vitamin E
Vit. E
Vitamin B1
Vit. B1
Vitamin B2
Vit. B2
Vitamin B3
Vit. B3
Vitamin B5
Vit. B5
Vitamin B6
Vit. B6
Vitamin B12
Vit. B12
Vitamin K
Vit. K
Folate
Folate
0%
0%
46%
0%
17%
22%
136%
57%
107%
778%
0%
1.5%
2
100 g
300 g
Vitamin C
Vit. C
Vitamin D
Vit. D
Vitamin A
Vit. A
Vitamin E
Vit. E
Vitamin B1
Vit. B1
Vitamin B2
Vit. B2
Vitamin B3
Vit. B3
Vitamin B5
Vit. B5
Vitamin B6
Vit. B6
Vitamin B12
Vit. B12
Vitamin K
Vit. K
Folate
Folate
0%
0%
0%
0%
25%
162%
94%
0%
0%
0%
0%
0%
All nutrients comparison - raw data values
Nutrient
DV% diff.
Vitamin B12
6.22µg
259%
Selenium
46.8µg
85%
Vitamin B2
0.097mg
0.7mg
46%
Vitamin B6
0.464mg
36%
Cholesterol
76mg
25%
Iron
0.62mg
2.1mg
19%
Vitamin B5
0.955mg
19%
Protein
25.69g
16.6g
18%
Phosphorus
291mg
412mg
17%
Vitamin A
138µg
15%
Potassium
477mg
14%
Vitamin B3
7.247mg
5mg
14%
Magnesium
42mg
10%
Zinc
1.04mg
9%
Polyunsaturated fat
1.358g
9%
Copper
0.068mg
8%
Monounsaturated fat
2.297g
6%
Saturated fat
1.172g
5%
Fats
5.44g
8g
4%
Sodium
77mg
3%
Vitamin B1
0.067mg
0.1mg
3%
Calcium
9mg
28mg
2%
Carbs
0g
4.3g
1%
Manganese
0.027mg
1%
Folate
2µg
1%
Calories
159kcal
156kcal
0%
Protein per 100 calories
16g
11g
N/A
Calories per 10 g protein
62kcal
94kcal
N/A
Weight per 100 calories
63g
64g
N/A
Unsaturated / Saturated Fat ratio
3.1
N/A
Net carbs
0g
4.3g
N/A
Tryptophan
0.288mg
0%
Threonine
1.126mg
0%
Isoleucine
1.184mg
0%
Leucine
2.088mg
0%
Lysine
2.36mg
0%
Methionine
0.76mg
0%
Phenylalanine
1.003mg
0%
Valine
1.324mg
0%
Histidine
0.756mg
0%
Omega-3 - EPA
0.323g
N/A
Omega-3 - DHA
0.665g
N/A
Omega-3 - DPA
0.079g
N/A
Macronutrient Comparison
Macronutrient breakdown side-by-side comparison
2
26%
5%
63%
6%
Protein:
25.69 g
Fats:
5.44 g
Carbs:
0 g
Water:
62.64 g
Other:
6.23 g
3
17%
8%
4%
70%
Protein:
16.6 g
Fats:
8 g
Carbs:
4.3 g
Water:
69.8 g
Other:
1.3 g
Contains
more
Protein Protein
+54.8%
Contains
more
Other Other
+379.2%
Contains
more
Fats Fats
+47.1%
Contains
more
Carbs Carbs
+∞%
Contains
more
Water Water
+11.4%