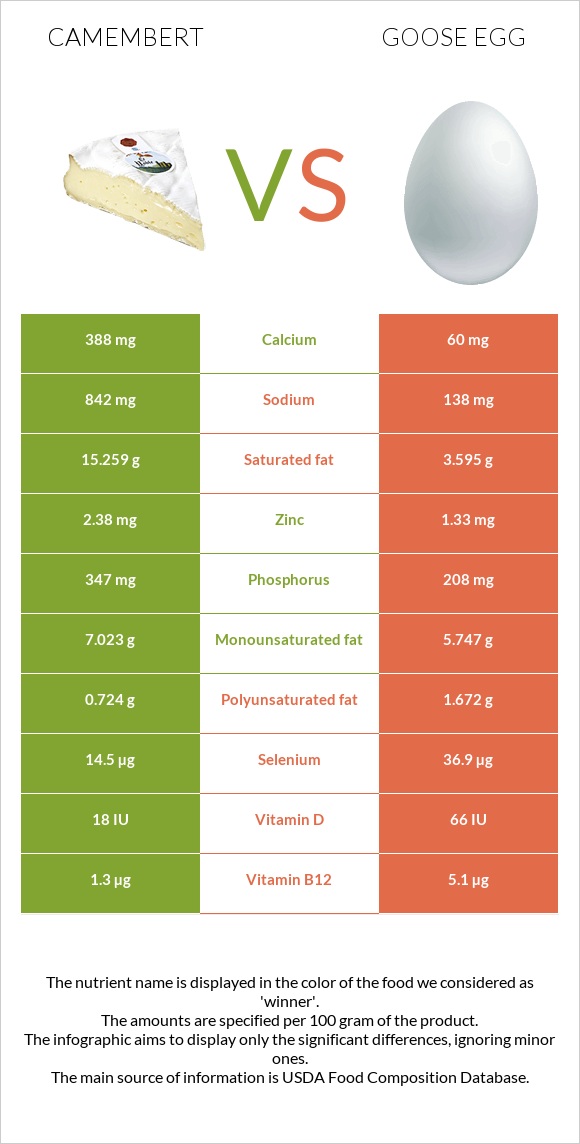
What are the main differences between camembert and goose eggs? Camembert is richer in calcium and phosphorus, while goose eggs are higher in vitamin B12, choline, iron, selenium, and vitamin B1. Goose eggs' daily need coverage for cholesterol is 260% higher. Goose eggs have 6 times less calcium than camembert. Camembert has 388mg of calcium, while goose eggs have 60mg. Goose eggs are lower in sodium. We used Cheese, camembert and Egg, goose, whole, fresh, raw types in this comparison.
Infographic
Mineral Comparison
Mineral comparison score is based on the number of minerals by which one or the other food is richer. The "coverage" charts below show how much of the daily needs can be covered by 300 grams of the food.
4
100 g
300 g
1 cubic inch - 17g 1 oz - 28.35g 1 wedge (1.33 oz) - 38g 1 cup - 246g
Magnesium
Magnesium
Calcium
Calcium
Potassium
Potassium
Iron
Iron
Copper
Copper
Zinc
Zinc
Phosphorus
Phosphorus
Sodium
Sodium
Manganese
Manganese
Selenium
Selenium
14%
116%
17%
12%
7%
65%
149%
110%
5%
79%
5
100 g
300 g
1 egg - 144g
Magnesium
Magnesium
Calcium
Calcium
Potassium
Potassium
Iron
Iron
Copper
Copper
Zinc
Zinc
Phosphorus
Phosphorus
Sodium
Sodium
Manganese
Manganese
Selenium
Selenium
11%
18%
19%
137%
21%
36%
89%
18%
5%
201%
Vitamin Comparison
Vitamin comparison score is based on the number of vitamins by which one or the other food is richer. The "coverage" charts below show how much of the daily needs can be covered by 300 grams of the food.
4
100 g
300 g
1 cubic inch - 17g 1 oz - 28.35g 1 wedge (1.33 oz) - 38g 1 cup - 246g
Vitamin C
Vit. C
Vitamin D
Vit. D
Vitamin A
Vit. A
Vitamin E
Vit. E
Vitamin B1
Vit. B1
Vitamin B2
Vit. B2
Vitamin B3
Vit. B3
Vitamin B5
Vit. B5
Vitamin B6
Vit. B6
Vitamin B12
Vit. B12
Vitamin K
Vit. K
Folate
Folate
0%
6%
80%
4.2%
7%
113%
12%
82%
52%
163%
5%
47%
6
100 g
300 g
1 egg - 144g
Vitamin C
Vit. C
Vitamin D
Vit. D
Vitamin A
Vit. A
Vitamin E
Vit. E
Vitamin B1
Vit. B1
Vitamin B2
Vit. B2
Vitamin B3
Vit. B3
Vitamin B5
Vit. B5
Vitamin B6
Vit. B6
Vitamin B12
Vit. B12
Vitamin K
Vit. K
Folate
Folate
0%
26%
62%
26%
37%
88%
3.5%
106%
54%
638%
1%
57%
All nutrients comparison - raw data values
Nutrient
DV% diff.
Cholesterol
72mg
852mg
260%
Vitamin B12
1.3µg
5.1µg
158%
Saturated fat
15.259g
3.595g
53%
Choline
15.4mg
263.4mg
45%
Iron
0.33mg
3.64mg
41%
Selenium
14.5µg
36.9µg
41%
Calcium
388mg
60mg
33%
Sodium
842mg
138mg
31%
Phosphorus
347mg
208mg
20%
Fats
24.26g
13.27g
17%
Protein
19.8g
13.87g
12%
Zinc
2.38mg
1.33mg
10%
Vitamin B1
0.028mg
0.147mg
10%
Vitamin B2
0.488mg
0.382mg
8%
Vitamin B5
1.364mg
1.759mg
8%
Vitamin D
0.4µg
1.7µg
7%
Vitamin E
0.21mg
1.29mg
7%
Calories
300kcal
185kcal
6%
Vitamin D*
18 IU
66 IU
6%
Vitamin A
241µg
187µg
6%
Polyunsaturated fat
0.724g
1.672g
6%
Copper
0.021mg
0.062mg
5%
Folate
62µg
76µg
4%
Vitamin B3
0.63mg
0.189mg
3%
Monounsaturated fat
7.023g
5.747g
3%
Magnesium
20mg
16mg
1%
Potassium
187mg
210mg
1%
Vitamin B6
0.227mg
0.236mg
1%
Vitamin K
2µg
0.4µg
1%
Protein per 100 calories
6.6g
7.5g
N/A
Calories per 10 g protein
152kcal
133kcal
N/A
Weight per 100 calories
33g
54g
N/A
Unsaturated / Saturated Fat ratio
0.51
2.1
N/A
Net carbs
0.46g
1.35g
N/A
Carbs
0.46g
1.35g
0%
Sugar
0.46g
0.94g
N/A
Manganese
0.038mg
0.038mg
0%
Tryptophan
0.307mg
0.282mg
0%
Threonine
0.717mg
0.797mg
0%
Isoleucine
0.968mg
0.647mg
0%
Leucine
1.84mg
1.188mg
0%
Lysine
1.766mg
1.03mg
0%
Methionine
0.565mg
0.624mg
0%
Phenylalanine
1.105mg
0.91mg
0%
Valine
1.279mg
0.958mg
0%
Histidine
0.683mg
0.346mg
0%
Macronutrient Comparison
Macronutrient breakdown side-by-side comparison
3
20%
24%
52%
4%
Protein:
19.8 g
Fats:
24.26 g
Carbs:
0.46 g
Water:
51.8 g
Other:
3.68 g
2
14%
13%
70%
Protein:
13.87 g
Fats:
13.27 g
Carbs:
1.35 g
Water:
70.43 g
Other:
1.08 g
Contains
more
Protein Protein
+42.8%
Contains
more
Fats Fats
+82.8%
Contains
more
Other Other
+240.7%
Contains
more
Carbs Carbs
+193.5%
Contains
more
Water Water
+36%
Fat Type Comparison
Fat type breakdown side-by-side comparison
1
66%
31%
3%
Saturated fat:
Sat. Fat
15.259 g
Monounsaturated fat:
Mono. Fat
7.023 g
Polyunsaturated fat:
Poly. Fat
0.724 g
2
33%
52%
15%
Saturated fat:
Sat. Fat
3.595 g
Monounsaturated fat:
Mono. Fat
5.747 g
Polyunsaturated fat:
Poly. Fat
1.672 g
Contains
more
Mono. Fat Monounsaturated fat
+22.2%
Contains
less
Sat. Fat Saturated fat
-76.4%
Contains
more
Poly. Fat Polyunsaturated fat
+130.9%