
Chinook salmon vs. Shark — In-Depth Nutrition Comparison
Compare
What are the main differences between chinook salmon and shark?
- Shark has less vitamin B12, vitamin B3, phosphorus, selenium, magnesium, protein, vitamin B6, vitamin A, and potassium than chinook salmon.
- Chinook salmon's daily need coverage for vitamin B12 is 69% higher.
- Chinook salmon has 4 times more vitamin B3 than shark. Chinook salmon has 10.045mg of vitamin B3, while shark has 2.783mg.
- Shark contains less cholesterol.
We used Fish, salmon, chinook, cooked, dry heat and Fish, shark, mixed species, cooked, batter-dipped and fried types in this comparison.
Infographic
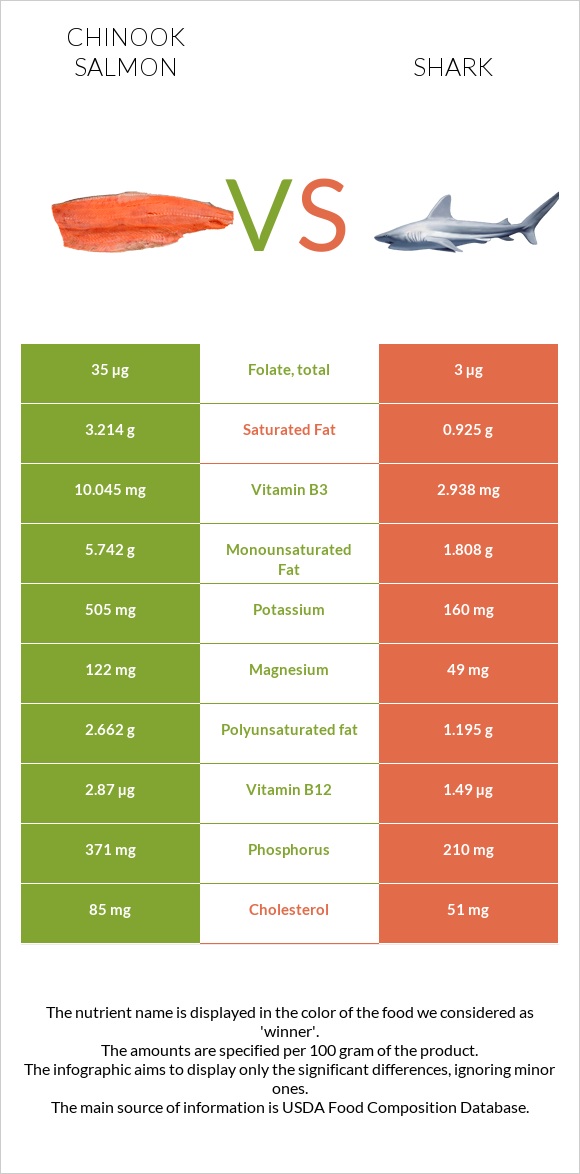
Infographic link
Mineral Comparison
The mineral comparison score is based on which food has a more favorable amount of each mineral. The �coverage� charts below show how much of the daily mineral needs are covered by the selected amount of each food.
| Contains more MagnesiumMagnesium | +183.7% |
| Contains more PotassiumPotassium | +225.8% |
| Contains more CopperCopper | +26.2% |
| Contains more ZincZinc | +16.7% |
| Contains more PhosphorusPhosphorus | +91.2% |
| Contains less SodiumSodium | -50.8% |
| Contains more SeleniumSelenium | +37.6% |
| Contains more CalciumCalcium | +78.6% |
| Contains more IronIron | +22% |
| Contains more ManganeseManganese | +163.2% |
Vitamin Comparison
The vitamin comparison score is based on the number of vitamins in which one food is richer than the other. The �coverage� charts below show how much of the daily vitamin needs are covered by the selected amount of each food.
| Contains more Vitamin CVitamin C | +∞% |
| Contains more Vitamin AVitamin A | +175.9% |
| Contains more Vitamin B2Vitamin B2 | +58.8% |
| Contains more Vitamin B3Vitamin B3 | +260.9% |
| Contains more Vitamin B5Vitamin B5 | +39.5% |
| Contains more Vitamin B6Vitamin B6 | +54% |
| Contains more Vitamin B12Vitamin B12 | +137.2% |
| Contains more FolateFolate | +133.3% |
| Contains more Vitamin B1Vitamin B1 | +63.6% |
All nutrients comparison - raw data values
| Nutrient |  |
 |
DV% diff. |
| Vitamin B12 | 2.87µg | 1.21µg | 69% |
| Vitamin B3 | 10.045mg | 2.783mg | 45% |
| Phosphorus | 371mg | 194mg | 25% |
| Selenium | 46.8µg | 34µg | 23% |
| Magnesium | 122mg | 43mg | 19% |
| Protein | 25.72g | 18.62g | 14% |
| Vitamin B6 | 0.462mg | 0.3mg | 12% |
| Vitamin A | 149µg | 54µg | 11% |
| Potassium | 505mg | 155mg | 10% |
| Cholesterol | 85mg | 59mg | 9% |
| Polyunsaturated fat | 2.662g | 3.701g | 7% |
| Vitamin C | 4.1mg | 0mg | 5% |
| Vitamin B5 | 0.865mg | 0.62mg | 5% |
| Folate | 35µg | 15µg | 5% |
| Vitamin B2 | 0.154mg | 0.097mg | 4% |
| Iron | 0.91mg | 1.11mg | 3% |
| Sodium | 60mg | 122mg | 3% |
| Carbs | 0g | 6.39g | 2% |
| Calcium | 28mg | 50mg | 2% |
| Vitamin B1 | 0.044mg | 0.072mg | 2% |
| Fats | 13.38g | 13.82g | 1% |
| Copper | 0.053mg | 0.042mg | 1% |
| Zinc | 0.56mg | 0.48mg | 1% |
| Manganese | 0.019mg | 0.05mg | 1% |
| Calories | 231kcal | 228kcal | 0% |
| Protein per 100 calories | 11g | 8.2g | N/A |
| Calories per 10 g protein | 90kcal | 122kcal | N/A |
| Weight per 100 calories | 43g | 44g | N/A |
| Unsaturated / Saturated Fat ratio | 2.6 | 3 | N/A |
| Net carbs | 0g | 6.39g | N/A |
| Saturated fat | 3.214g | 3.205g | 0% |
| Monounsaturated fat | 5.742g | 5.935g | 0% |
| Tryptophan | 0.288mg | 0.212mg | 0% |
| Threonine | 1.127mg | 0.843mg | 0% |
| Isoleucine | 1.185mg | 0.867mg | 0% |
| Leucine | 2.09mg | 1.515mg | 0% |
| Lysine | 2.362mg | 1.634mg | 0% |
| Methionine | 0.761mg | 0.541mg | 0% |
| Phenylalanine | 1.004mg | 0.75mg | 0% |
| Valine | 1.325mg | 0.965mg | 0% |
| Histidine | 0.757mg | 0.538mg | 0% |
| Omega-3 (EPA) | 1.01g | 0.258g | N/A |
| Omega-3 (DHA) | 0.727g | 0.431g | N/A |
| Omega-3 (DPA) | 0.296g | 0.089g | N/A |
Macronutrient Comparison
Macronutrient breakdown side-by-side comparison
Protein:
25.72 g
Fats:
13.38 g
Carbs:
0 g
Water:
65.6 g
Other:
0 g
Protein:
18.62 g
Fats:
13.82 g
Carbs:
6.39 g
Water:
60.09 g
Other:
1.08 g
| Contains more ProteinProtein | +38.1% |
| Contains more CarbsCarbs | +∞% |
~equal in
Fats
~13.82g
~equal in
Water
~60.09g
Fat Type Comparison
Fat type breakdown side-by-side comparison
Saturated fat:
Sat. Fat
3.214 g
Monounsaturated fat:
Mono. Fat
5.742 g
Polyunsaturated fat:
Poly. Fat
2.662 g
Saturated fat:
Sat. Fat
3.205 g
Monounsaturated fat:
Mono. Fat
5.935 g
Polyunsaturated fat:
Poly. Fat
3.701 g
| Contains more Poly. FatPolyunsaturated fat | +39% |
~equal in
Saturated fat
~3.205g
~equal in
Monounsaturated fat
~5.935g


