
Macaroon vs. Tortilla — In-Depth Nutrition Comparison
Compare
The main differences between macaroon and tortillas
- Macaroon is richer in fats, yet tortillas are richer in vitamin B1, selenium, phosphorus, folate, vitamin B3, calcium, iron, and fiber.
- Daily need coverage for saturated fat for macaroon is 76% higher.
- Macaroon contains 2 times more fats than tortillas. Macaroon contains 22.55g of fats, while tortillas contain 9.76g.
- Tortillas contain less saturated fat.
- Macaroon has a lower glycemic index than tortillas.
Food types used in this article are Cookies, coconut macaroon and Tortillas, ready-to-bake or -fry, whole wheat.
Infographic
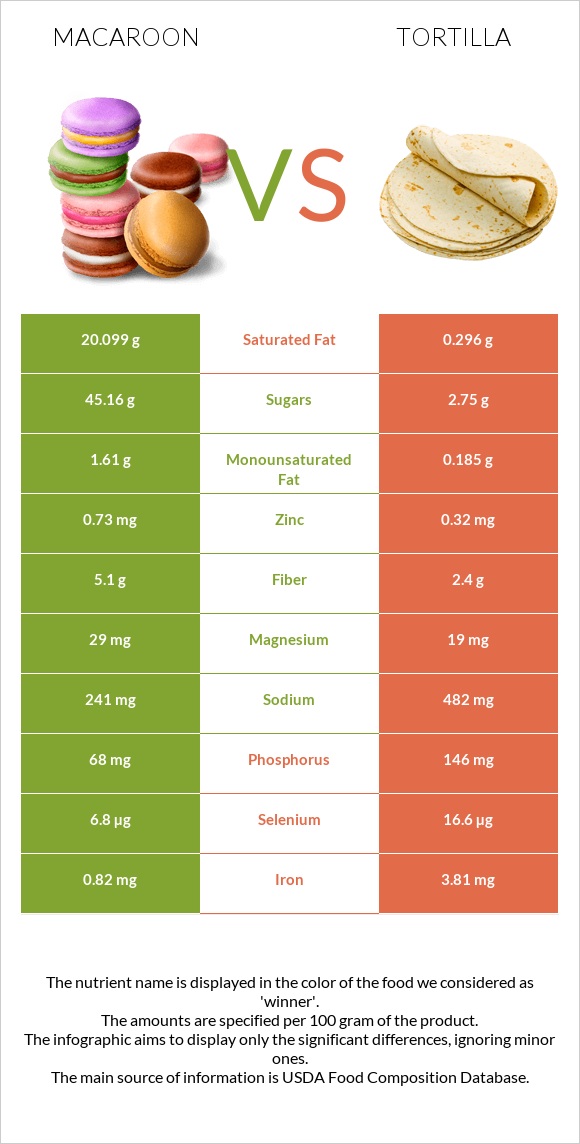
Infographic link
Mineral Comparison
The mineral comparison score is based on which food has a more favorable amount of each mineral. The �coverage� charts below show how much of the daily mineral needs are covered by the selected amount of each food.
| Contains less SodiumSodium | -52.9% |
| Contains more MagnesiumMagnesium | +193.1% |
| Contains more CalciumCalcium | +4780% |
| Contains more PotassiumPotassium | +113% |
| Contains more IronIron | +220.7% |
| Contains more ZincZinc | +163% |
| Contains more PhosphorusPhosphorus | +408.8% |
| Contains more SeleniumSelenium | +444.1% |
Vitamin Comparison
The vitamin comparison score is based on the number of vitamins in which one food is richer than the other. The �coverage� charts below show how much of the daily vitamin needs are covered by the selected amount of each food.
| Contains more Vitamin EVitamin E | +373.7% |
| Contains more Vitamin B1Vitamin B1 | +4015% |
| Contains more Vitamin B2Vitamin B2 | +381.7% |
| Contains more Vitamin B3Vitamin B3 | +2108.2% |
| Contains more Vitamin B6Vitamin B6 | +225% |
| Contains more Vitamin KVitamin K | +309.1% |
| Contains more FolateFolate | +4500% |
All nutrients comparison - raw data values
| Nutrient |  |
 |
DV% diff. |
| Saturated fat | 20.099g | 4.878g | 69% |
| Vitamin B1 | 0.02mg | 0.823mg | 67% |
| Selenium | 6.8µg | 37µg | 55% |
| Phosphorus | 68mg | 346mg | 40% |
| Folate | 3µg | 138µg | 34% |
| Vitamin B3 | 0.22mg | 4.858mg | 29% |
| Calcium | 5mg | 244mg | 24% |
| Iron | 0.82mg | 2.63mg | 23% |
| Fats | 22.55g | 9.76g | 20% |
| Fiber | 5.1g | 9.8g | 19% |
| Vitamin B2 | 0.06mg | 0.289mg | 18% |
| Vitamin B6 | 0.096mg | 0.312mg | 17% |
| Protein | 3.02g | 9.76g | 13% |
| Magnesium | 29mg | 85mg | 13% |
| Sodium | 241mg | 512mg | 12% |
| Zinc | 0.73mg | 1.92mg | 11% |
| Calories | 460kcal | 310kcal | 8% |
| Carbs | 61.22g | 45.89g | 5% |
| Vitamin E | 0.19mg | 0.9mg | 5% |
| Potassium | 123mg | 262mg | 4% |
| Monounsaturated fat | 1.61g | 3.062g | 4% |
| Vitamin K | 1.1µg | 4.5µg | 3% |
| Choline | 9.1mg | 20mg | 2% |
| Polyunsaturated fat | 0.81g | 0.992g | 1% |
| Protein per 100 calories | 0.66g | 3.1g | N/A |
| Calories per 10 g protein | 1523kcal | 318kcal | N/A |
| Weight per 100 calories | 22g | 32g | N/A |
| Unsaturated / Saturated Fat ratio | 0.12 | 0.83 | N/A |
| Net carbs | 56.12g | 36.09g | N/A |
| Sugar | 45.16g | 2.44g | N/A |
| Copper | 0.269mg | 0.266mg | 0% |
| Tryptophan | 0.129mg | 0% | |
| Threonine | 0.312mg | 0% | |
| Isoleucine | 0.353mg | 0% | |
| Leucine | 0.671mg | 0% | |
| Lysine | 0.37mg | 0% | |
| Methionine | 0.163mg | 0% | |
| Phenylalanine | 0.488mg | 0% | |
| Valine | 0.444mg | 0% | |
| Histidine | 0.255mg | 0% |
Macronutrient Comparison
Macronutrient breakdown side-by-side comparison
| Contains more FatsFats | +131% |
| Contains more CarbsCarbs | +33.4% |
| Contains more ProteinProtein | +223.2% |
| Contains more WaterWater | +162.2% |
Fat Type Comparison
Fat type breakdown side-by-side comparison
| Contains less Sat. FatSaturated fat | -75.7% |
| Contains more Mono. FatMonounsaturated fat | +90.2% |
| Contains more Poly. FatPolyunsaturated fat | +22.5% |


