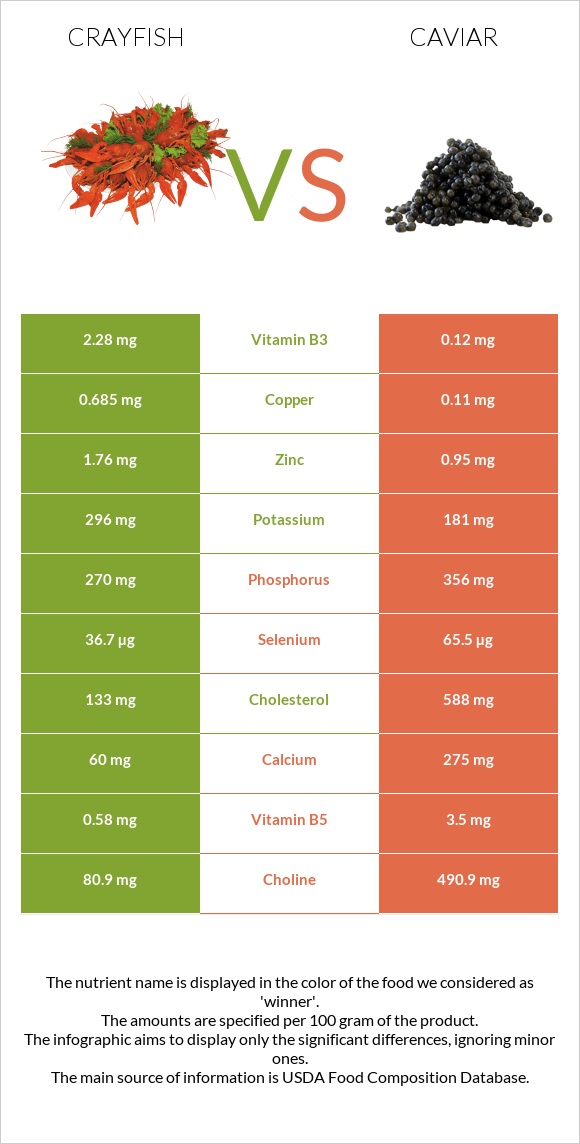
How are crayfish and caviar different? Crayfish is richer in copper, while caviar is higher in vitamin B12, iron, choline, magnesium, vitamin B5, selenium, and vitamin B2. Caviar covers your daily need for vitamin B12, 744% more than crayfish. Crayfish contains 6 times more copper than caviar. Crayfish contains 0.685mg of copper, while caviar contains 0.11mg. Crayfish is lower in cholesterol. Crustaceans, crayfish, mixed species, wild, cooked, moist heat and Fish, caviar, black, and red, granular types were used in this article.
Infographic
Mineral Comparison
Mineral comparison score is based on the number of minerals by which one or the other food is richer. The "coverage" charts below show how much of the daily needs can be covered by 300 grams of the food.
5
100 g
300 g
3 oz - 85g
Magnesium
Magnesium
Calcium
Calcium
Potassium
Potassium
Iron
Iron
Copper
Copper
Zinc
Zinc
Phosphorus
Phosphorus
Sodium
Sodium
Manganese
Manganese
Selenium
Selenium
24%
18%
26%
31%
228%
48%
116%
12%
68%
200%
5
100 g
300 g
1 tbsp - 16g 1 oz - 28.35g
Magnesium
Magnesium
Calcium
Calcium
Potassium
Potassium
Iron
Iron
Copper
Copper
Zinc
Zinc
Phosphorus
Phosphorus
Sodium
Sodium
Manganese
Manganese
Selenium
Selenium
214%
83%
16%
446%
37%
26%
153%
196%
6.5%
357%
Vitamin Comparison
Vitamin comparison score is based on the number of vitamins by which one or the other food is richer. The "coverage" charts below show how much of the daily needs can be covered by 300 grams of the food.
2
100 g
300 g
3 oz - 85g
Vitamin C
Vit. C
Vitamin D
Vit. D
Vitamin A
Vit. A
Vitamin E
Vit. E
Vitamin B1
Vit. B1
Vitamin B2
Vit. B2
Vitamin B3
Vit. B3
Vitamin B5
Vit. B5
Vitamin B6
Vit. B6
Vitamin B12
Vit. B12
Vitamin K
Vit. K
Folate
Folate
3%
0%
5%
30%
13%
20%
43%
35%
18%
269%
0.25%
33%
10
100 g
300 g
1 tbsp - 16g 1 oz - 28.35g
Vitamin C
Vit. C
Vitamin D
Vit. D
Vitamin A
Vit. A
Vitamin E
Vit. E
Vitamin B1
Vit. B1
Vitamin B2
Vit. B2
Vitamin B3
Vit. B3
Vitamin B5
Vit. B5
Vitamin B6
Vit. B6
Vitamin B12
Vit. B12
Vitamin K
Vit. K
Folate
Folate
0%
44%
90%
38%
48%
143%
2.3%
210%
74%
2500%
1.5%
38%
All nutrients comparison - raw data values
Nutrient
DV% diff.
Vitamin B12
2.15µg
20µg
744%
Cholesterol
133mg
588mg
152%
Iron
0.83mg
11.88mg
138%
Choline
80.9mg
490.9mg
75%
Magnesium
33mg
300mg
64%
Copper
0.685mg
0.11mg
64%
Sodium
94mg
1500mg
61%
Vitamin B5
0.58mg
3.5mg
58%
Selenium
36.7µg
65.5µg
52%
Polyunsaturated fat
0.367g
7.405g
47%
Vitamin B2
0.085mg
0.62mg
41%
Vitamin A
15µg
271µg
28%
Fats
1.2g
17.9g
26%
Calcium
60mg
275mg
22%
Manganese
0.522mg
0.05mg
21%
Vitamin B6
0.076mg
0.32mg
19%
Saturated fat
0.181g
4.06g
18%
Protein
16.77g
24.6g
16%
Vitamin D*
0 IU
117 IU
15%
Vitamin D
0µg
2.9µg
15%
Vitamin B3
2.28mg
0.12mg
14%
Phosphorus
270mg
356mg
12%
Vitamin B1
0.05mg
0.19mg
12%
Monounsaturated fat
0.244g
4.631g
11%
Calories
82kcal
264kcal
9%
Zinc
1.76mg
0.95mg
7%
Potassium
296mg
181mg
3%
Vitamin E
1.5mg
1.89mg
3%
Folate
44µg
50µg
2%
Vitamin C
0.9mg
0mg
1%
Carbs
0g
4g
1%
Protein per 100 calories
20g
9.3g
N/A
Calories per 10 g protein
49kcal
107kcal
N/A
Weight per 100 calories
122g
38g
N/A
Unsaturated / Saturated Fat ratio
3.4
3
N/A
Net carbs
0g
4g
N/A
Vitamin K
0.1µg
0.6µg
0%
Tryptophan
0.234mg
0.323mg
0%
Threonine
0.676mg
1.263mg
0%
Isoleucine
0.811mg
1.035mg
0%
Leucine
1.329mg
2.133mg
0%
Lysine
1.457mg
1.834mg
0%
Methionine
0.472mg
0.646mg
0%
Phenylalanine
0.706mg
1.071mg
0%
Valine
0.786mg
1.263mg
0%
Histidine
0.341mg
0.649mg
0%
Omega-3 - EPA
0.119g
2.741g
N/A
Omega-3 - DHA
0.047g
3.8g
N/A
Omega-3 - DPA
0g
0.229g
N/A
Macronutrient Comparison
Macronutrient breakdown side-by-side comparison
1
17%
79%
3%
Protein:
16.77 g
Fats:
1.2 g
Carbs:
0 g
Water:
79.37 g
Other:
2.66 g
4
25%
18%
4%
48%
6%
Protein:
24.6 g
Fats:
17.9 g
Carbs:
4 g
Water:
47.5 g
Other:
6 g
Contains
more
Water Water
+67.1%
Contains
more
Protein Protein
+46.7%
Contains
more
Fats Fats
+1391.7%
Contains
more
Carbs Carbs
+∞%
Contains
more
Other Other
+125.6%
Fat Type Comparison
Fat type breakdown side-by-side comparison
1
23%
31%
46%
Saturated fat:
Sat. Fat
0.181 g
Monounsaturated fat:
Mono. Fat
0.244 g
Polyunsaturated fat:
Poly. Fat
0.367 g
2
25%
29%
46%
Saturated fat:
Sat. Fat
4.06 g
Monounsaturated fat:
Mono. Fat
4.631 g
Polyunsaturated fat:
Poly. Fat
7.405 g
Contains
less
Sat. Fat Saturated fat
-95.5%
Contains
more
Mono. Fat Monounsaturated fat
+1798%
Contains
more
Poly. Fat Polyunsaturated fat
+1917.7%