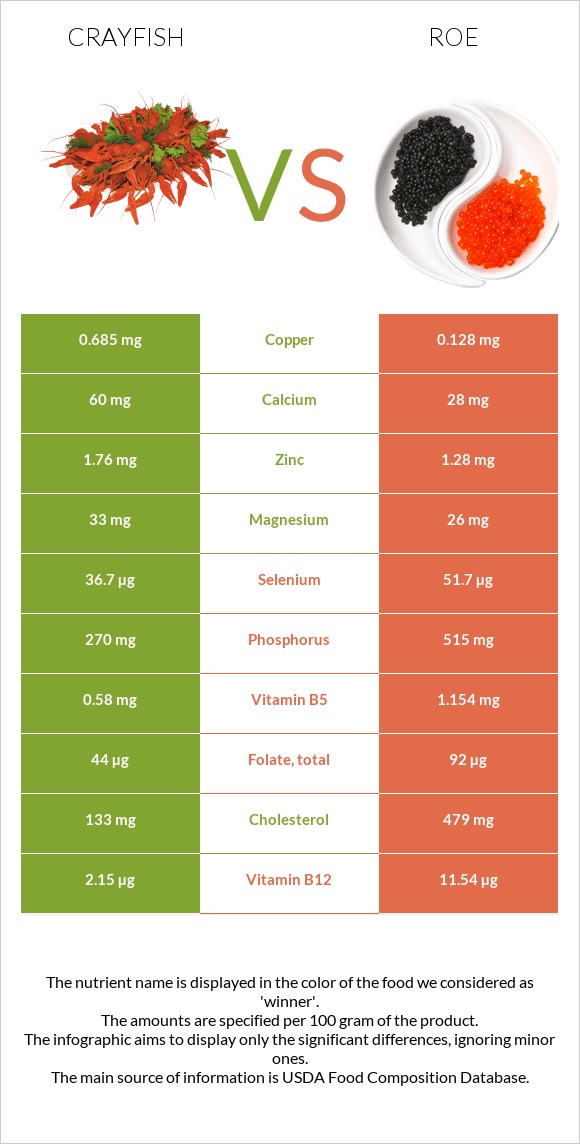
Summary of differences between crayfish and roe Crayfish has more copper and manganese; however, roe is higher in vitamin B12, vitamin B2, phosphorus, selenium, vitamin B1, vitamin C, and folate. Roe covers your daily need for vitamin B12, 391% more than crayfish. Crayfish has 40 times more manganese than roe. While crayfish has 0.522mg of manganese, roe has only 0.013mg. Crayfish has less cholesterol. The glycemic index of roe is higher. These are the specific foods used in this comparison Crustaceans, crayfish, mixed species, wild, cooked, moist heat and Fish, roe, mixed species, cooked, dry heat .
Infographic
Mineral Comparison
Mineral comparison score is based on the number of minerals by which one or the other food is richer. The "coverage" charts below show how much of the daily needs can be covered by 300 grams of the food.
6
100 g
300 g
3 oz - 85g
Magnesium
Magnesium
Calcium
Calcium
Potassium
Potassium
Iron
Iron
Copper
Copper
Zinc
Zinc
Phosphorus
Phosphorus
Sodium
Sodium
Manganese
Manganese
Selenium
Selenium
24%
18%
26%
31%
228%
48%
116%
12%
68%
200%
2
100 g
300 g
1 oz - 28.35g 3 oz - 85g
Magnesium
Magnesium
Calcium
Calcium
Potassium
Potassium
Iron
Iron
Copper
Copper
Zinc
Zinc
Phosphorus
Phosphorus
Sodium
Sodium
Manganese
Manganese
Selenium
Selenium
19%
8.4%
25%
29%
43%
35%
221%
15%
1.7%
282%
Vitamin Comparison
Vitamin comparison score is based on the number of vitamins by which one or the other food is richer. The "coverage" charts below show how much of the daily needs can be covered by 300 grams of the food.
2
100 g
300 g
3 oz - 85g
Vitamin C
Vit. C
Vitamin D
Vit. D
Vitamin A
Vit. A
Vitamin E
Vit. E
Vitamin B1
Vit. B1
Vitamin B2
Vit. B2
Vitamin B3
Vit. B3
Vitamin B5
Vit. B5
Vitamin B6
Vit. B6
Vitamin B12
Vit. B12
Vitamin K
Vit. K
Folate
Folate
3%
0%
5%
30%
13%
20%
43%
35%
18%
269%
0.25%
33%
8
100 g
300 g
1 oz - 28.35g 3 oz - 85g
Vitamin C
Vit. C
Vitamin D
Vit. D
Vitamin A
Vit. A
Vitamin E
Vit. E
Vitamin B1
Vit. B1
Vitamin B2
Vit. B2
Vitamin B3
Vit. B3
Vitamin B5
Vit. B5
Vitamin B6
Vit. B6
Vitamin B12
Vit. B12
Vitamin K
Vit. K
Folate
Folate
55%
0%
30%
0%
69%
219%
41%
69%
43%
1443%
0%
69%
All nutrients comparison - raw data values
Nutrient
DV% diff.
Vitamin B12
2.15µg
11.54µg
391%
Cholesterol
133mg
479mg
115%
Vitamin B2
0.085mg
0.949mg
66%
Copper
0.685mg
0.128mg
62%
Phosphorus
270mg
515mg
35%
Selenium
36.7µg
51.7µg
27%
Protein
16.77g
28.62g
24%
Manganese
0.522mg
0.013mg
22%
Polyunsaturated fat
0.367g
3.404g
20%
Vitamin B1
0.05mg
0.277mg
19%
Vitamin C
0.9mg
16.4mg
17%
Choline
80.9mg
15%
Folate
44µg
92µg
12%
Fats
1.2g
8.23g
11%
Vitamin B5
0.58mg
1.154mg
11%
Vitamin E
1.5mg
10%
Vitamin A
15µg
91µg
8%
Vitamin B6
0.076mg
0.185mg
8%
Saturated fat
0.181g
1.866g
8%
Calories
82kcal
204kcal
6%
Monounsaturated fat
0.244g
2.129g
5%
Zinc
1.76mg
1.28mg
4%
Calcium
60mg
28mg
3%
Magnesium
33mg
26mg
2%
Carbs
0g
1.92g
1%
Iron
0.83mg
0.77mg
1%
Sodium
94mg
117mg
1%
Vitamin B3
2.28mg
2.192mg
1%
Protein per 100 calories
20g
14g
N/A
Calories per 10 g protein
49kcal
71kcal
N/A
Weight per 100 calories
122g
49g
N/A
Unsaturated / Saturated Fat ratio
3.4
3
N/A
Net carbs
0g
1.92g
N/A
Potassium
296mg
283mg
0%
Vitamin K
0.1µg
0%
Tryptophan
0.234mg
0.375mg
0%
Threonine
0.676mg
1.305mg
0%
Isoleucine
0.811mg
1.465mg
0%
Leucine
1.329mg
2.509mg
0%
Lysine
1.457mg
2.179mg
0%
Methionine
0.472mg
0.71mg
0%
Phenylalanine
0.706mg
1.401mg
0%
Valine
0.786mg
1.676mg
0%
Histidine
0.341mg
0.778mg
0%
Omega-3 - EPA
0.119g
1.26g
N/A
Omega-3 - DHA
0.047g
1.747g
N/A
Omega-3 - DPA
0g
0.105g
N/A
Macronutrient Comparison
Macronutrient breakdown side-by-side comparison
2
17%
79%
3%
Protein:
16.77 g
Fats:
1.2 g
Carbs:
0 g
Water:
79.37 g
Other:
2.66 g
3
29%
8%
2%
59%
3%
Protein:
28.62 g
Fats:
8.23 g
Carbs:
1.92 g
Water:
58.63 g
Other:
2.6 g
Contains
more
Water Water
+35.4%
Contains
more
Protein Protein
+70.7%
Contains
more
Fats Fats
+585.8%
Contains
more
Carbs Carbs
+∞%
Fat Type Comparison
Fat type breakdown side-by-side comparison
1
23%
31%
46%
Saturated fat:
Sat. Fat
0.181 g
Monounsaturated fat:
Mono. Fat
0.244 g
Polyunsaturated fat:
Poly. Fat
0.367 g
2
25%
29%
46%
Saturated fat:
Sat. Fat
1.866 g
Monounsaturated fat:
Mono. Fat
2.129 g
Polyunsaturated fat:
Poly. Fat
3.404 g
Contains
less
Sat. Fat Saturated fat
-90.3%
Contains
more
Mono. Fat Monounsaturated fat
+772.5%
Contains
more
Poly. Fat Polyunsaturated fat
+827.5%