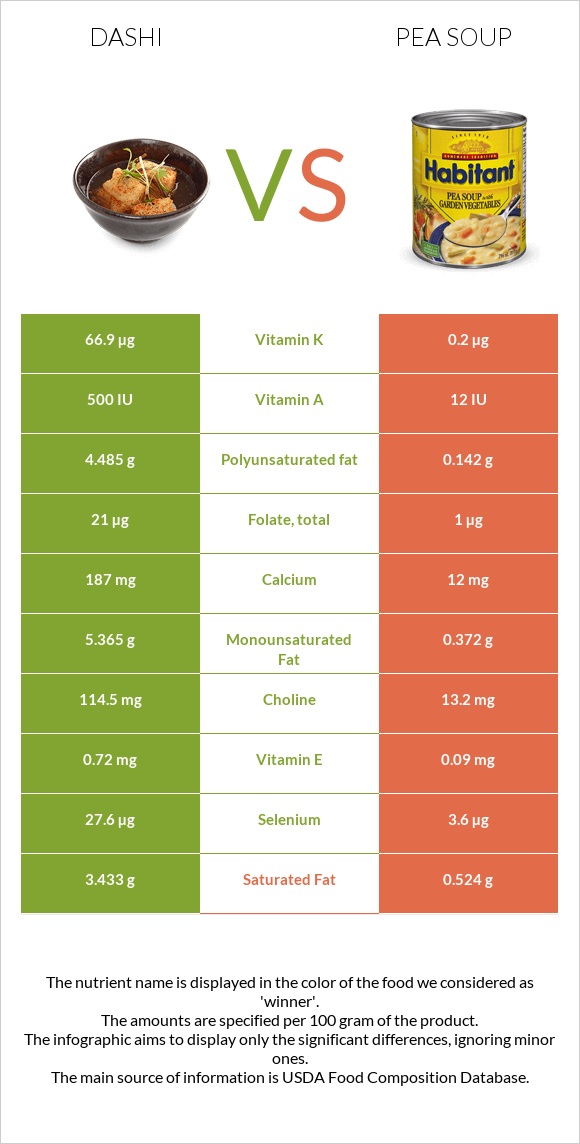
Significant differences between dashi and pea soup Dashi has more vitamin K, selenium, vitamin B2, choline, calcium, phosphorus, and vitamin B12; however, pea soup is richer in copper. Dashi covers your daily vitamin K needs 56% more than pea soup. Pea soup contains less saturated fat. Specific food types used in this comparison are Soup, bouillon cubes, and granules, low sodium, dry and Soup, pea, green, canned, prepared with equal volume water .
Infographic
Mineral Comparison
Mineral comparison score is based on the number of minerals by which one or the other food is richer. The "coverage" charts below show how much of the daily needs can be covered by 300 grams of the food.
6
100 g
300 g
1 tsp - 2.6g 1 cube - 3.6g
Magnesium
Magnesium
Calcium
Calcium
Potassium
Potassium
Iron
Iron
Copper
Copper
Zinc
Zinc
Phosphorus
Phosphorus
Sodium
Sodium
Manganese
Manganese
Selenium
Selenium
40%
56%
27%
39%
0%
2.5%
71%
139%
0%
151%
4
100 g
300 g
1 fl oz - 32.4g 1 serving 1 cup - 259g
Magnesium
Magnesium
Calcium
Calcium
Potassium
Potassium
Iron
Iron
Copper
Copper
Zinc
Zinc
Phosphorus
Phosphorus
Sodium
Sodium
Manganese
Manganese
Selenium
Selenium
11%
3.6%
6.3%
27%
49%
17%
20%
44%
32%
20%
Vitamin Comparison
Vitamin comparison score is based on the number of vitamins by which one or the other food is richer. The "coverage" charts below show how much of the daily needs can be covered by 300 grams of the food.
10
100 g
300 g
1 tsp - 2.6g 1 cube - 3.6g
Vitamin C
Vit. C
Vitamin D
Vit. D
Vitamin A
Vit. A
Vitamin E
Vit. E
Vitamin B1
Vit. B1
Vitamin B2
Vit. B2
Vitamin B3
Vit. B3
Vitamin B5
Vit. B5
Vitamin B6
Vit. B6
Vitamin B12
Vit. B12
Vitamin K
Vit. K
Folate
Folate
3.7%
0%
8.3%
14%
25%
99%
46%
0%
23%
38%
167%
16%
1
100 g
300 g
1 fl oz - 32.4g 1 serving 1 cup - 259g
Vitamin C
Vit. C
Vitamin D
Vit. D
Vitamin A
Vit. A
Vitamin E
Vit. E
Vitamin B1
Vit. B1
Vitamin B2
Vit. B2
Vitamin B3
Vit. B3
Vitamin B5
Vit. B5
Vitamin B6
Vit. B6
Vitamin B12
Vit. B12
Vitamin K
Vit. K
Folate
Folate
2%
0%
1%
1.8%
10%
5.8%
8.7%
2.9%
4.6%
0%
0.5%
0.75%
All nutrients comparison - raw data values
Nutrient
DV% diff.
Vitamin K
66.9µg
0.2µg
56%
Selenium
27.6µg
3.6µg
44%
Sodium
1067mg
336mg
32%
Vitamin B2
0.43mg
0.025mg
31%
Polyunsaturated fat
4.485g
0.142g
29%
Protein
16.7g
3.2g
27%
Fats
13.89g
1.09g
20%
Calories
438kcal
61kcal
19%
Carbs
64.88g
9.88g
18%
Calcium
187mg
12mg
18%
Choline
114.5mg
13.2mg
18%
Phosphorus
166mg
47mg
17%
Copper
0mg
0.146mg
16%
Vitamin B12
0.3µg
0µg
13%
Saturated fat
3.433g
0.524g
13%
Vitamin B3
2.46mg
0.462mg
12%
Monounsaturated fat
5.365g
0.372g
12%
Manganese
0.245mg
11%
Magnesium
56mg
15mg
10%
Potassium
309mg
71mg
7%
Fiber
0.2g
1.9g
7%
Vitamin B6
0.1mg
0.02mg
6%
Zinc
0.09mg
0.64mg
5%
Vitamin B1
0.1mg
0.04mg
5%
Folate
21µg
1µg
5%
Cholesterol
13mg
0mg
4%
Iron
1.03mg
0.73mg
4%
Vitamin E
0.72mg
0.09mg
4%
Vitamin A
25µg
3µg
2%
Vitamin C
1.1mg
0.6mg
1%
Vitamin B5
0.049mg
1%
Protein per 100 calories
3.8g
5.2g
N/A
Calories per 10 g protein
262kcal
191kcal
N/A
Weight per 100 calories
23g
164g
N/A
Unsaturated / Saturated Fat ratio
2.9
0.98
N/A
Net carbs
64.68g
7.98g
N/A
Sugar
14.47g
3.19g
N/A
Macronutrient Comparison
Macronutrient breakdown side-by-side comparison
4
17%
14%
65%
2%
2%
Protein:
16.7 g
Fats:
13.89 g
Carbs:
64.88 g
Water:
2.3 g
Other:
2.23 g
1
3%
10%
85%
Protein:
3.2 g
Fats:
1.09 g
Carbs:
9.88 g
Water:
84.55 g
Other:
1.28 g
Contains
more
Protein Protein
+421.9%
Contains
more
Fats Fats
+1174.3%
Contains
more
Carbs Carbs
+556.7%
Contains
more
Other Other
+74.2%
Contains
more
Water Water
+3576.1%
Fat Type Comparison
Fat type breakdown side-by-side comparison
2
26%
40%
34%
Saturated fat:
Sat. Fat
3.433 g
Monounsaturated fat:
Mono. Fat
5.365 g
Polyunsaturated fat:
Poly. Fat
4.485 g
1
50%
36%
14%
Saturated fat:
Sat. Fat
0.524 g
Monounsaturated fat:
Mono. Fat
0.372 g
Polyunsaturated fat:
Poly. Fat
0.142 g
Contains
more
Mono. Fat Monounsaturated fat
+1342.2%
Contains
more
Poly. Fat Polyunsaturated fat
+3058.5%
Contains
less
Sat. Fat Saturated fat
-84.7%