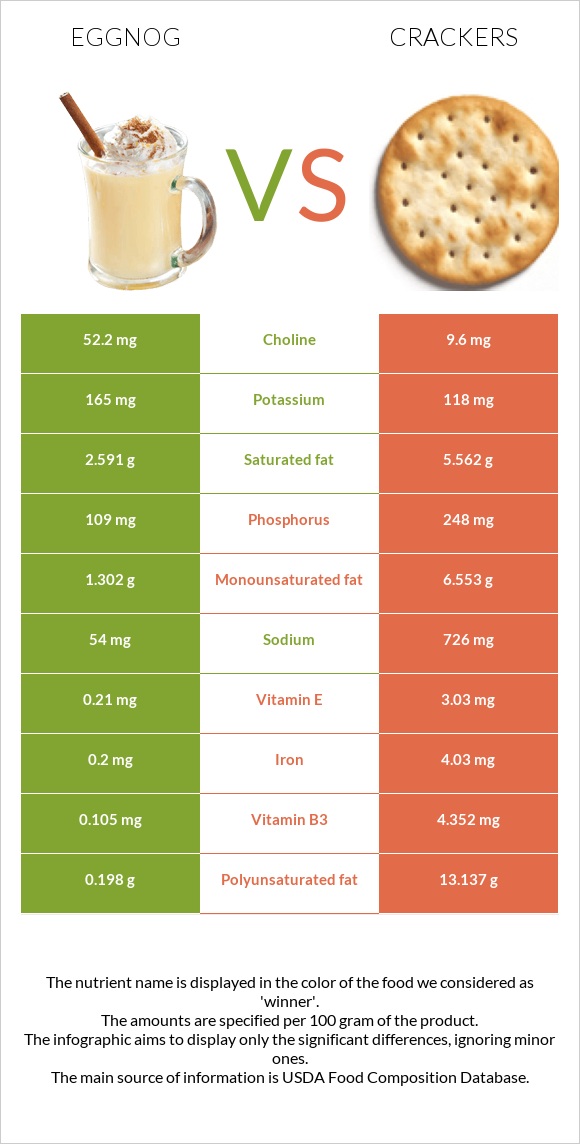
What are the main differences between eggnog and crackers? Crackers have more vitamin K, iron, vitamin B1, vitamin B3, folate, manganese, vitamin B2, and phosphorus than eggnog. Crackers' daily need coverage for vitamin K is 58% higher. We used Eggnog and Crackers, standard snack-type, regular types in this comparison.
Infographic
Mineral Comparison
Mineral comparison score is based on the number of minerals by which one or the other food is richer. The "coverage" charts below show how much of the daily needs can be covered by 300 grams of the food.
2
100 g
300 g
1 fl oz - 31.8g 1 cup - 254g 1 quart - 1016g
Magnesium
Magnesium
Calcium
Calcium
Potassium
Potassium
Iron
Iron
Copper
Copper
Zinc
Zinc
Phosphorus
Phosphorus
Sodium
Sodium
Manganese
Manganese
Selenium
Selenium
14%
39%
15%
7.5%
4.3%
13%
47%
7%
0.65%
23%
5
100 g
300 g
1 cracker, round - 3.2g 1 cracker, rectangular - 4g 5 crackers - 16g 5 crackers, regular size, round (1 serving) - 16g 1 cup crushed - 52g
Magnesium
Magnesium
Calcium
Calcium
Potassium
Potassium
Iron
Iron
Copper
Copper
Zinc
Zinc
Phosphorus
Phosphorus
Sodium
Sodium
Manganese
Manganese
Selenium
Selenium
13%
36%
10%
151%
35%
13%
106%
95%
64%
37%
Vitamin Comparison
Vitamin comparison score is based on the number of vitamins by which one or the other food is richer. The "coverage" charts below show how much of the daily needs can be covered by 300 grams of the food.
4
100 g
300 g
1 fl oz - 31.8g 1 cup - 254g 1 quart - 1016g
Vitamin C
Vit. C
Vitamin D
Vit. D
Vitamin A
Vit. A
Vitamin E
Vit. E
Vitamin B1
Vit. B1
Vitamin B2
Vit. B2
Vitamin B3
Vit. B3
Vitamin B5
Vit. B5
Vitamin B6
Vit. B6
Vitamin B12
Vit. B12
Vitamin K
Vit. K
Folate
Folate
5%
18%
20%
4.2%
8.5%
44%
2%
25%
12%
56%
0.75%
0.75%
7
100 g
300 g
1 cracker, round - 3.2g 1 cracker, rectangular - 4g 5 crackers - 16g 5 crackers, regular size, round (1 serving) - 16g 1 cup crushed - 52g
Vitamin C
Vit. C
Vitamin D
Vit. D
Vitamin A
Vit. A
Vitamin E
Vit. E
Vitamin B1
Vit. B1
Vitamin B2
Vit. B2
Vitamin B3
Vit. B3
Vitamin B5
Vit. B5
Vitamin B6
Vit. B6
Vitamin B12
Vit. B12
Vitamin K
Vit. K
Folate
Folate
0%
0%
0%
61%
104%
105%
82%
25%
15%
0%
173%
69%
All nutrients comparison - raw data values
Nutrient
DV% diff.
Polyunsaturated fat
0.198g
13.137g
86%
Vitamin K
0.3µg
69.3µg
58%
Iron
0.2mg
4.03mg
48%
Fats
4.19g
26.43g
34%
Vitamin B1
0.034mg
0.416mg
32%
Sodium
54mg
726mg
29%
Vitamin B3
0.105mg
4.352mg
27%
Folate
1µg
92µg
23%
Calories
88kcal
510kcal
21%
Manganese
0.005mg
0.491mg
21%
Cholesterol
59mg
0mg
20%
Starch
49.69g
20%
Phosphorus
109mg
248mg
20%
Vitamin B2
0.19mg
0.456mg
20%
Vitamin E
0.21mg
3.03mg
19%
Vitamin B12
0.45µg
0µg
19%
Carbs
8.05g
61.3g
18%
Saturated fat
2.591g
5.562g
14%
Monounsaturated fat
1.302g
6.553g
13%
Copper
0.013mg
0.104mg
10%
Fiber
0g
2.3g
9%
Choline
52.2mg
9.6mg
8%
Vitamin A
59µg
0µg
7%
Vitamin D*
49 IU
0 IU
6%
Vitamin D
1.2µg
0µg
6%
Selenium
4.2µg
6.7µg
5%
Protein
4.55g
6.64g
4%
Vitamin C
1.5mg
0mg
2%
Calcium
130mg
120mg
1%
Potassium
165mg
118mg
1%
Vitamin B6
0.05mg
0.063mg
1%
Protein per 100 calories
5.2g
1.3g
N/A
Calories per 10 g protein
193kcal
768kcal
N/A
Weight per 100 calories
114g
20g
N/A
Unsaturated / Saturated Fat ratio
0.58
3.5
N/A
Net carbs
8.05g
59g
N/A
Magnesium
19mg
18mg
0%
Sugar
8.05g
8.18g
N/A
Zinc
0.46mg
0.49mg
0%
Vitamin B5
0.417mg
0.417mg
0%
Trans fat
1.076g
N/A
Tryptophan
0.085mg
0.084mg
0%
Threonine
0.201mg
0.193mg
0%
Isoleucine
0.237mg
0.246mg
0%
Leucine
0.383mg
0.471mg
0%
Lysine
0.257mg
0.103mg
0%
Methionine
0.12mg
0.112mg
0%
Phenylalanine
0.225mg
0.331mg
0%
Valine
0.289mg
0.294mg
0%
Histidine
0.108mg
0.145mg
0%
Fructose
0.04g
0.29g
0%
Omega-3 - ALA
1.485g
N/A
Omega-6 - Gamma-linoleic acid
0.062g
N/A
Omega-6 - Eicosadienoic acid
0.009g
N/A
Omega-6 - Linoleic acid
11.48g
N/A
Macronutrient Comparison
Macronutrient breakdown side-by-side comparison
1
5%
4%
8%
83%
Protein:
4.55 g
Fats:
4.19 g
Carbs:
8.05 g
Water:
82.54 g
Other:
0.67 g
4
7%
26%
61%
3%
2%
Protein:
6.64 g
Fats:
26.43 g
Carbs:
61.3 g
Water:
3.14 g
Other:
2.49 g
Contains
more
Water Water
+2528.7%
Contains
more
Protein Protein
+45.9%
Contains
more
Fats Fats
+530.8%
Contains
more
Carbs Carbs
+661.5%
Contains
more
Other Other
+271.6%
Fat Type Comparison
Fat type breakdown side-by-side comparison
1
63%
32%
5%
Saturated fat:
Sat. Fat
2.591 g
Monounsaturated fat:
Mono. Fat
1.302 g
Polyunsaturated fat:
Poly. Fat
0.198 g
2
22%
26%
52%
Saturated fat:
Sat. Fat
5.562 g
Monounsaturated fat:
Mono. Fat
6.553 g
Polyunsaturated fat:
Poly. Fat
13.137 g
Contains
less
Sat. Fat Saturated fat
-53.4%
Contains
more
Mono. Fat Monounsaturated fat
+403.3%
Contains
more
Poly. Fat Polyunsaturated fat
+6534.8%
Carbohydrate type comparison
Carbohydrate type breakdown side-by-side comparison
2
97%
Starch:
0 g
Sucrose:
0.04 g
Glucose:
0.07 g
Fructose:
0.04 g
Lactose:
7.84 g
Maltose:
0.04 g
Galactose:
0.04 g
5
86%
12%
Starch:
49.69 g
Sucrose:
6.95 g
Glucose:
0.47 g
Fructose:
0.29 g
Lactose:
0 g
Maltose:
0.48 g
Galactose:
0 g
Contains
more
Lactose Lactose
+∞%
Contains
more
Galactose Galactose
+∞%
Contains
more
Starch Starch
+∞%
Contains
more
Sucrose Sucrose
+17275%
Contains
more
Glucose Glucose
+571.4%
Contains
more
Fructose Fructose
+625%
Contains
more
Maltose Maltose
+1100%