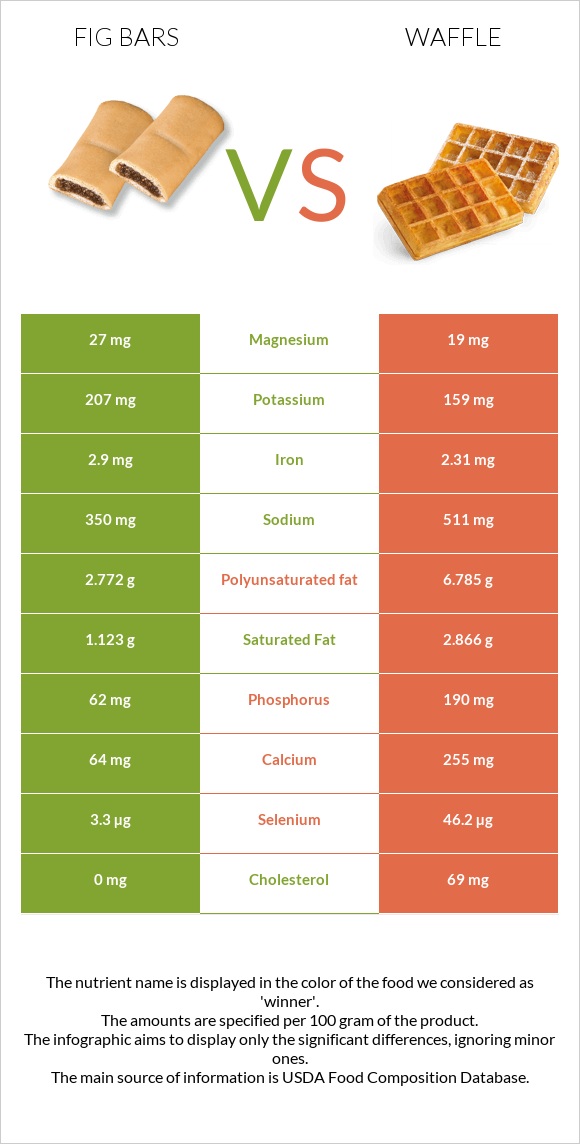
What are the differences between fig bars and waffle? Fig bars are higher in copper and iron, yet waffle is higher in selenium, calcium, phosphorus, vitamin B2, and vitamin B1. Waffle's daily need coverage for selenium is 78% more. Fig bars have 2 times more copper than waffle. While fig bars have 0.147mg of copper, waffle has only 0.062mg. The amount of sodium in fig bars is lower. We used Cookies, fig bars and Waffles, plain, prepared from recipe types in this article.
Infographic
Mineral Comparison
Mineral comparison score is based on the number of minerals by which one or the other food is richer. The "coverage" charts below show how much of the daily needs can be covered by 300 grams of the food.
6
100 g
300 g
1 cookie - 16g 1 oz - 28.35g 1 Figaroo (2 square halves) - 43g 1 individual package (2 oz package containing 2 3" bars) - 57g
Magnesium
Magnesium
Calcium
Calcium
Potassium
Potassium
Iron
Iron
Copper
Copper
Zinc
Zinc
Phosphorus
Phosphorus
Sodium
Sodium
Manganese
Manganese
Selenium
Selenium
19%
19%
18%
109%
49%
11%
27%
46%
45%
18%
4
100 g
300 g
1 oz - 28.35g 1 waffle, round (7" dia) - 75g
Magnesium
Magnesium
Calcium
Calcium
Potassium
Potassium
Iron
Iron
Copper
Copper
Zinc
Zinc
Phosphorus
Phosphorus
Sodium
Sodium
Manganese
Manganese
Selenium
Selenium
14%
77%
14%
87%
21%
19%
81%
67%
35%
252%
Vitamin Comparison
Vitamin comparison score is based on the number of vitamins by which one or the other food is richer. The "coverage" charts below show how much of the daily needs can be covered by 300 grams of the food.
3
100 g
300 g
1 cookie - 16g 1 oz - 28.35g 1 Figaroo (2 square halves) - 43g 1 individual package (2 oz package containing 2 3" bars) - 57g
Vitamin C
Vit. C
Vitamin D
Vit. D
Vitamin A
Vit. A
Vitamin E
Vit. E
Vitamin B1
Vit. B1
Vitamin B2
Vit. B2
Vitamin B3
Vit. B3
Vitamin B5
Vit. B5
Vitamin B6
Vit. B6
Vitamin B12
Vit. B12
Vitamin K
Vit. K
Folate
Folate
1%
0%
3%
13%
40%
50%
35%
22%
17%
11%
15%
26%
8
100 g
300 g
1 oz - 28.35g 1 waffle, round (7" dia) - 75g
Vitamin C
Vit. C
Vitamin D
Vit. D
Vitamin A
Vit. A
Vitamin E
Vit. E
Vitamin B1
Vit. B1
Vitamin B2
Vit. B2
Vitamin B3
Vit. B3
Vitamin B5
Vit. B5
Vitamin B6
Vit. B6
Vitamin B12
Vit. B12
Vitamin K
Vit. K
Folate
Folate
1.3%
0%
22%
0%
66%
80%
39%
29%
13%
31%
0%
35%
All nutrients comparison - raw data values
Nutrient
DV% diff.
Selenium
3.3µg
46.2µg
78%
Polyunsaturated fat
2.772g
6.785g
27%
Cholesterol
0mg
69mg
23%
Calcium
64mg
255mg
19%
Fiber
4.6g
18%
Phosphorus
62mg
190mg
18%
Carbs
70.9g
32.9g
13%
Fats
7.3g
14.1g
10%
Vitamin B2
0.217mg
0.347mg
10%
Copper
0.147mg
0.062mg
9%
Vitamin B1
0.158mg
0.263mg
9%
Protein
3.7g
7.9g
8%
Saturated fat
1.123g
2.866g
8%
Iron
2.9mg
2.31mg
7%
Sodium
350mg
511mg
7%
Vitamin B12
0.09µg
0.25µg
7%
Vitamin A
9µg
65µg
6%
Vitamin K
5.8µg
5%
Vitamin E
0.65mg
4%
Calories
348kcal
291kcal
3%
Zinc
0.39mg
0.68mg
3%
Manganese
0.343mg
0.265mg
3%
Folate
35µg
46µg
3%
Choline
14.6mg
3%
Magnesium
27mg
19mg
2%
Vitamin B5
0.364mg
0.485mg
2%
Potassium
207mg
159mg
1%
Vitamin B3
1.874mg
2.073mg
1%
Vitamin B6
0.075mg
0.056mg
1%
Monounsaturated fat
3.003g
3.521g
1%
Protein per 100 calories
1.1g
2.7g
N/A
Calories per 10 g protein
941kcal
368kcal
N/A
Weight per 100 calories
29g
34g
N/A
Unsaturated / Saturated Fat ratio
5.1
3.6
N/A
Vitamin C
0.3mg
0.4mg
0%
Net carbs
66.3g
32.9g
N/A
Sugar
46.36g
N/A
Tryptophan
0.046mg
0.099mg
0%
Threonine
0.113mg
0.289mg
0%
Isoleucine
0.132mg
0.362mg
0%
Leucine
0.224mg
0.63mg
0%
Lysine
0.14mg
0.384mg
0%
Methionine
0.053mg
0.179mg
0%
Phenylalanine
0.145mg
0.395mg
0%
Valine
0.155mg
0.409mg
0%
Histidine
0.067mg
0.187mg
0%
Omega-3 - EPA
0g
0.001g
N/A
Omega-3 - DHA
0g
0.006g
N/A
Macronutrient Comparison
Macronutrient breakdown side-by-side comparison
1
4%
7%
71%
17%
Protein:
3.7 g
Fats:
7.3 g
Carbs:
70.9 g
Water:
16.5 g
Other:
1.6 g
4
8%
14%
33%
42%
3%
Protein:
7.9 g
Fats:
14.1 g
Carbs:
32.9 g
Water:
42 g
Other:
3.1 g
Contains
more
Carbs Carbs
+115.5%
Contains
more
Protein Protein
+113.5%
Contains
more
Fats Fats
+93.2%
Contains
more
Water Water
+154.5%
Contains
more
Other Other
+93.8%
Fat Type Comparison
Fat type breakdown side-by-side comparison
1
16%
44%
40%
Saturated fat:
Sat. Fat
1.123 g
Monounsaturated fat:
Mono. Fat
3.003 g
Polyunsaturated fat:
Poly. Fat
2.772 g
2
22%
27%
52%
Saturated fat:
Sat. Fat
2.866 g
Monounsaturated fat:
Mono. Fat
3.521 g
Polyunsaturated fat:
Poly. Fat
6.785 g
Contains
less
Sat. Fat Saturated fat
-60.8%
Contains
more
Mono. Fat Monounsaturated fat
+17.2%
Contains
more
Poly. Fat Polyunsaturated fat
+144.8%