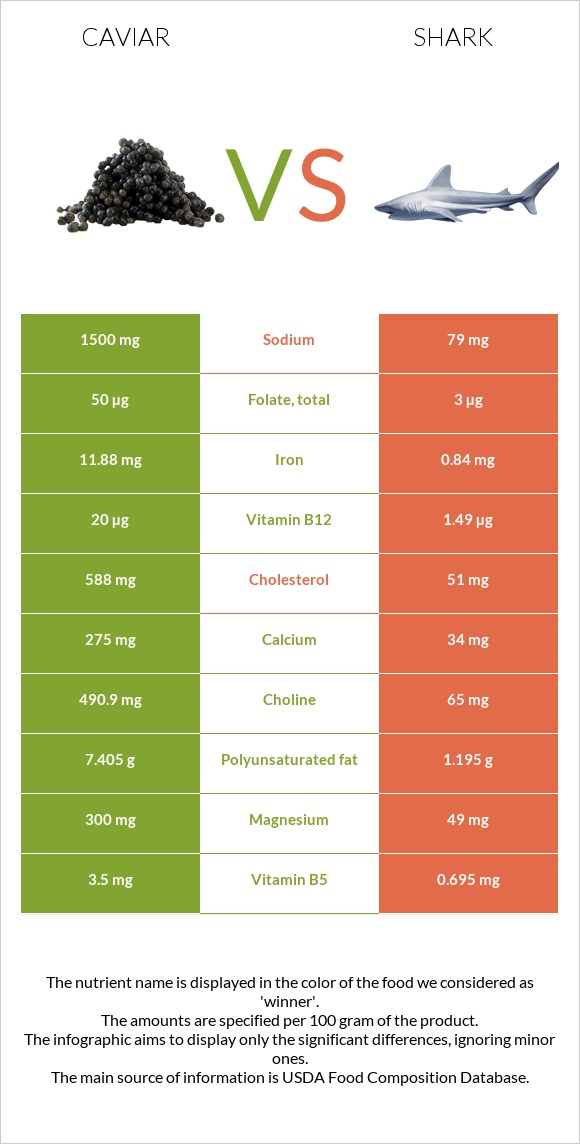
How are caviar and shark different? Caviar is higher than shark in vitamin B12, iron, magnesium, vitamin B5, selenium, vitamin B2, phosphorus, and calcium. Caviar covers your daily need for vitamin B12, 783% more than shark. Caviar contains 12 times more sodium than shark. Caviar contains 1500mg of sodium, while shark contains 122mg. Fish, caviar, black, and red, granular and Fish, shark, mixed species, cooked, batter-dipped and fried types were used in this article.
Infographic
Mineral Comparison
Mineral comparison score is based on the number of minerals by which one or the other food is richer. The "coverage" charts below show how much of the daily needs can be covered by 300 grams of the food.
8
100 g
300 g
1 tbsp - 16g 1 oz - 28.35g
Magnesium
Magnesium
Calcium
Calcium
Potassium
Potassium
Iron
Iron
Copper
Copper
Zinc
Zinc
Phosphorus
Phosphorus
Sodium
Sodium
Manganese
Manganese
Selenium
Selenium
214%
83%
16%
446%
37%
26%
153%
196%
6.5%
357%
1
100 g
300 g
3 oz - 85g
Magnesium
Magnesium
Calcium
Calcium
Potassium
Potassium
Iron
Iron
Copper
Copper
Zinc
Zinc
Phosphorus
Phosphorus
Sodium
Sodium
Manganese
Manganese
Selenium
Selenium
31%
15%
14%
42%
14%
13%
83%
16%
6.5%
185%
Vitamin Comparison
Vitamin comparison score is based on the number of vitamins by which one or the other food is richer. The "coverage" charts below show how much of the daily needs can be covered by 300 grams of the food.
9
100 g
300 g
1 tbsp - 16g 1 oz - 28.35g
Vitamin C
Vit. C
Vitamin D
Vit. D
Vitamin A
Vit. A
Vitamin E
Vit. E
Vitamin B1
Vit. B1
Vitamin B2
Vit. B2
Vitamin B3
Vit. B3
Vitamin B5
Vit. B5
Vitamin B6
Vit. B6
Vitamin B12
Vit. B12
Vitamin K
Vit. K
Folate
Folate
0%
44%
90%
38%
48%
143%
2.3%
210%
74%
2500%
1.5%
38%
1
100 g
300 g
3 oz - 85g
Vitamin C
Vit. C
Vitamin D
Vit. D
Vitamin A
Vit. A
Vitamin E
Vit. E
Vitamin B1
Vit. B1
Vitamin B2
Vit. B2
Vitamin B3
Vit. B3
Vitamin B5
Vit. B5
Vitamin B6
Vit. B6
Vitamin B12
Vit. B12
Vitamin K
Vit. K
Folate
Folate
0%
0%
18%
0%
18%
22%
52%
37%
69%
151%
0%
11%
All nutrients comparison - raw data values
Nutrient
DV% diff.
Vitamin B12
20µg
1.21µg
783%
Cholesterol
588mg
59mg
176%
Iron
11.88mg
1.11mg
135%
Choline
490.9mg
89%
Magnesium
300mg
43mg
61%
Sodium
1500mg
122mg
60%
Vitamin B5
3.5mg
0.62mg
58%
Selenium
65.5µg
34µg
57%
Vitamin B2
0.62mg
0.097mg
40%
Polyunsaturated fat
7.405g
3.701g
25%
Vitamin A
271µg
54µg
24%
Calcium
275mg
50mg
23%
Phosphorus
356mg
194mg
23%
Vitamin B3
0.12mg
2.783mg
17%
Vitamin D*
117 IU
15%
Vitamin D
2.9µg
15%
Vitamin E
1.89mg
13%
Protein
24.6g
18.62g
12%
Vitamin B1
0.19mg
0.072mg
10%
Folate
50µg
15µg
9%
Copper
0.11mg
0.042mg
8%
Fats
17.9g
13.82g
6%
Zinc
0.95mg
0.48mg
4%
Saturated fat
4.06g
3.205g
4%
Monounsaturated fat
4.631g
5.935g
3%
Calories
264kcal
228kcal
2%
Vitamin B6
0.32mg
0.3mg
2%
Carbs
4g
6.39g
1%
Potassium
181mg
155mg
1%
Vitamin K
0.6µg
1%
Protein per 100 calories
9.3g
8.2g
N/A
Calories per 10 g protein
107kcal
122kcal
N/A
Weight per 100 calories
38g
44g
N/A
Unsaturated / Saturated Fat ratio
3
3
N/A
Net carbs
4g
6.39g
N/A
Manganese
0.05mg
0.05mg
0%
Tryptophan
0.323mg
0.212mg
0%
Threonine
1.263mg
0.843mg
0%
Isoleucine
1.035mg
0.867mg
0%
Leucine
2.133mg
1.515mg
0%
Lysine
1.834mg
1.634mg
0%
Methionine
0.646mg
0.541mg
0%
Phenylalanine
1.071mg
0.75mg
0%
Valine
1.263mg
0.965mg
0%
Histidine
0.649mg
0.538mg
0%
Omega-3 - EPA
2.741g
0.258g
N/A
Omega-3 - DHA
3.8g
0.431g
N/A
Omega-3 - DPA
0.229g
0.089g
N/A
Macronutrient Comparison
Macronutrient breakdown side-by-side comparison
3
25%
18%
4%
48%
6%
Protein:
24.6 g
Fats:
17.9 g
Carbs:
4 g
Water:
47.5 g
Other:
6 g
2
19%
14%
6%
60%
Protein:
18.62 g
Fats:
13.82 g
Carbs:
6.39 g
Water:
60.09 g
Other:
1.08 g
Contains
more
Protein Protein
+32.1%
Contains
more
Fats Fats
+29.5%
Contains
more
Other Other
+455.6%
Contains
more
Carbs Carbs
+59.8%
Contains
more
Water Water
+26.5%
Fat Type Comparison
Fat type breakdown side-by-side comparison
1
25%
29%
46%
Saturated fat:
Sat. Fat
4.06 g
Monounsaturated fat:
Mono. Fat
4.631 g
Polyunsaturated fat:
Poly. Fat
7.405 g
2
25%
46%
29%
Saturated fat:
Sat. Fat
3.205 g
Monounsaturated fat:
Mono. Fat
5.935 g
Polyunsaturated fat:
Poly. Fat
3.701 g
Contains
more
Poly. Fat Polyunsaturated fat
+100.1%
Contains
less
Sat. Fat Saturated fat
-21.1%
Contains
more
Mono. Fat Monounsaturated fat
+28.2%