
Fish oil vs. Table salt — In-Depth Nutrition Comparison
Compare
Differences between fish oil and table salt
- Table salt contains less fats, vitamin D*, omega-3 (DPA), monounsaturated fat, omega-3 (DHA) and polyunsaturated fat than fish oil.
- Table salt's daily need coverage for sodium is 1685% higher.
The food types used in this comparison are Fish oil, sardine and Salt, table.
Infographic
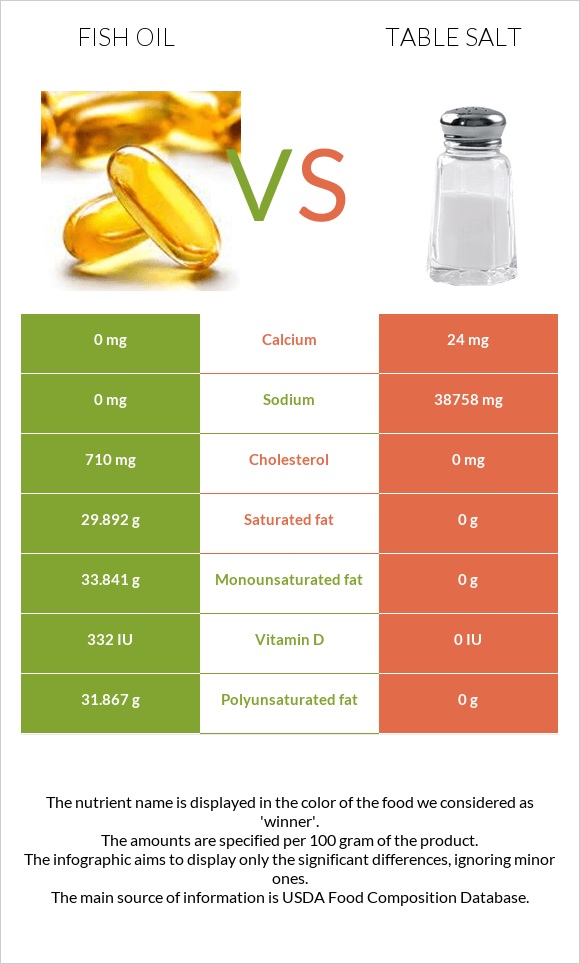
Infographic link
Mineral Comparison
The mineral comparison score is based on which food has a more favorable amount of each mineral. The �coverage� charts below show how much of the daily mineral needs are covered by the selected amount of each food.
| Contains less SodiumSodium | -100% |
| Contains more MagnesiumMagnesium | +∞% |
| Contains more CalciumCalcium | +∞% |
| Contains more PotassiumPotassium | +∞% |
| Contains more IronIron | +∞% |
| Contains more CopperCopper | +∞% |
| Contains more ZincZinc | +∞% |
| Contains more ManganeseManganese | +∞% |
| Contains more SeleniumSelenium | +∞% |
Vitamin Comparison
The vitamin comparison score is based on the number of vitamins in which one food is richer than the other. The �coverage� charts below show how much of the daily vitamin needs are covered by the selected amount of each food.
| Contains more Vitamin DVitamin D | +∞% |
All nutrients comparison - raw data values
| Nutrient |  |
 |
DV% diff. |
| Sodium | 0mg | 38758mg | 1685% |
| Cholesterol | 710mg | 0mg | 237% |
| Polyunsaturated fat | 31.867g | 0g | 212% |
| Fats | 100g | 0g | 154% |
| Saturated fat | 29.892g | 0g | 136% |
| Monounsaturated fat | 33.841g | 0g | 85% |
| Calories | 902kcal | 0kcal | 45% |
| Vitamin D* | 332 IU | 0 IU | 42% |
| Vitamin D | 8.3µg | 0µg | 42% |
| Iron | 0mg | 0.33mg | 4% |
| Manganese | 0mg | 0.1mg | 4% |
| Copper | 0mg | 0.03mg | 3% |
| Calcium | 0mg | 24mg | 2% |
| Zinc | 0mg | 0.1mg | 1% |
| Weight per 100 calories | 11g | N/A | |
| Unsaturated / Saturated Fat ratio | 2.2 | N/A | |
| Magnesium | 0mg | 1mg | 0% |
| Potassium | 0mg | 8mg | 0% |
| Selenium | 0µg | 0.1µg | 0% |
| Omega-3 (EPA) | 10.137g | 0g | N/A |
| Omega-3 (DHA) | 10.656g | 0g | N/A |
| Omega-3 (DPA) | 1.973g | 0g | N/A |
Macronutrient Comparison
Macronutrient breakdown side-by-side comparison
Protein:
0 g
Fats:
100 g
Carbs:
0 g
Water:
0 g
Other:
0 g
Protein:
0 g
Fats:
0 g
Carbs:
0 g
Water:
0.2 g
Other:
99.8 g
| Contains more FatsFats | +∞% |
| Contains more WaterWater | +∞% |
~equal in
Protein
~0g
~equal in
Carbs
~0g


