Table salt nutrition: calories, carbs, GI, protein, fiber, fats
Carbohydrates in Table Salt
Does salt have carbs?
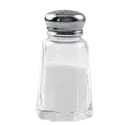
Table salt has a fascinating nutrient composition.
Unlike other seasonings, table salt contains no carbohydrates, as well as no fats and no protein.
It consists wholly of minerals, mainly sodium, but also calcium, manganese, copper, and others.
Macronutrients chart
Calories in Table Salt
As table salt contains no macronutrients, it also provides no calories. Even a 100g serving of table salt contains 0 calories.
Regardless of the calorie content, increased salt intake has been associated with weight gain and obesity (1, 2). This correlation may be because people with higher salt intake often present with worse eating habits.
A sudden rise in sodium intake may also lead to temporary weight gain through water retention in the body (3).
However, in many countries, about 80% of salt in the diet comes not from table salt but instead from processed foods (4).
Comparison to Other Seasonings
The table below shows how different table salt’s calorie content is compared to the calories of popular seasonings and spices.
| Food | Calories, per serving | Calories, per 100g |
| Table Salt | 0 | 0 |
| Nutmeg | 2.6 (0.25tsp or 0.5g) | 525 |
| Cumin | 1.9 (0.25tsp or 0.5g) | 375 |
| Garlic Powder | 1.7 (0.25tsp or 0.5g) | 331 |
| Curry Powder | 1.6 (0.25tsp or 0.5g) | 325 |
| Paprika | 1.4 (0.25tsp or 0.5g) | 282 |
| Black Pepper | 1.3 (0.25tsp or 0.5g) | 251 |
References
- https://www.researchgate.net/publication/263515478
- https://www.cambridge.org/core/journals/british-journal-of-nutrition/article/abs/E0EA07983B68910F0485160F08858C2E
- https://pubmed.ncbi.nlm.nih.gov/28414294/
- https://www.who.int/news-room/fact-sheets/detail/salt-reduction

Top nutrition facts for Table salt
| Calories ⓘ Calories for selected serving | 0 kcal |
|
Glycemic index ⓘ
Source: The food is assumed to have 0 or no glycemic index bason on the fact that it has no carbs and that foods with 0 carbs have no glycemic index
Check out our Glycemic index chart page for the full list.
|
0 (low) |
| Glycemic load ⓘ Glycemic Load (GL) is a metric that measures both the quality (Glycemic Index) and quantity of carbohydrates in a specific serving of food to estimate its impact on blood sugar levels. It is calculated as: (GI × Carbs in grams) / 100. | 0 (low) |
| Net carbs ⓘ Net Carbs = Total Carbohydrates – Fiber – Sugar Alcohols | 0 g |
| Default serving size ⓘ Serving sizes are mostly taken from FDA's Reference Amounts Customarily Consumed (RACCs) | 1 tsp (6 g) |
| Acidity (Based on PRAL) ⓘ PRAL (Potential renal acid load) is calculated using a formula. On the PRAL scale the higher the positive value, the more is the acidifying effect on the body. The lower the negative value, the higher the alkalinity of the food. 0 is neutral. | -0.5 (alkaline) |
Table salt calories (kcal)
| Calories for different serving sizes of table salt | Calories | Weight |
|---|---|---|
| Calories in 100 grams | 0 | |
| Calories in 1 dash | 0 | 0.4 g |
| Calories in 1 tsp | 0 | 6 g |
| Calories in 1 tbsp | 0 | 18 g |
| Calories in 1 cup | 0 | 292 g |
Table salt Glycemic index (GI)
Mineral coverage chart
Mineral chart - relative view
All nutrients for Table salt per 100g
| Nutrient | Value | DV% | In TOP % of foods | Comparison |
| Vitamin A | 0µg | 0% | 100% | |
| Calories | 0kcal | 0% | 100% |
N/A
|
| Protein | 0g | 0% | 100% |
N/A
|
| Fats | 0g | 0% | 100% |
N/A
|
| Vitamin C | 0mg | 0% | 100% |
N/A
|
| Carbs | 0g | 0% | 100% |
N/A
|
| Net carbs | 0g | N/A | 100% |
N/A
|
| Cholesterol | 0mg | 0% | 100% |
N/A
|
| Vitamin D* | 0 IU | 0% | 100% |
N/A
|
| Vitamin D | 0µg | 0% | 100% |
N/A
|
| Magnesium | 1mg | 0% | 89% |
140 times less than Almonds
|
| Calcium | 24mg | 2% | 46% |
5.2 times less than Milk
|
| Potassium | 8mg | 0% | 93% |
18.4 times less than Cucumber
|
| Iron | 0.33mg | 4% | 82% |
7.9 times less than Beef broiled
|
| Sugar | 0g | N/A | 100% |
N/A
|
| Fiber | 0g | 0% | 100% |
N/A
|
| Copper | 0.03mg | 3% | 75% |
4.7 times less than Shiitake
|
| Zinc | 0.1mg | 1% | 83% |
63.1 times less than Beef broiled
|
| Phosphorus | 0mg | 0% | 100% |
N/A
|
| Sodium | 38758mg | 1685% | 1% |
79.1 times more than White bread
|
| Vitamin E | 0mg | 0% | 100% |
N/A
|
| Manganese | 0.1mg | 4% | 37% | |
| Selenium | 0.1µg | 0% | 77% | |
| Vitamin B1 | 0mg | 0% | 100% |
N/A
|
| Vitamin B2 | 0mg | 0% | 100% |
N/A
|
| Vitamin B3 | 0mg | 0% | 100% |
N/A
|
| Vitamin B5 | 0mg | 0% | 100% |
N/A
|
| Vitamin B6 | 0mg | 0% | 100% |
N/A
|
| Vitamin B12 | 0µg | 0% | 100% |
N/A
|
| Vitamin K | 0µg | 0% | 100% |
N/A
|
| Trans fat | 0g | N/A | 100% |
N/A
|
| Folate | 0µg | 0% | 100% |
N/A
|
| Saturated fat | 0g | 0% | 100% |
N/A
|
| Choline | 0mg | 0% | 100% | |
| Monounsaturated fat | 0g | N/A | 100% |
N/A
|
| Polyunsaturated fat | 0g | N/A | 100% |
N/A
|
| Tryptophan | 0mg | 0% | 100% |
N/A
|
| Threonine | 0mg | 0% | 100% |
N/A
|
| Isoleucine | 0mg | 0% | 100% |
N/A
|
| Leucine | 0mg | 0% | 100% |
N/A
|
| Lysine | 0mg | 0% | 100% |
N/A
|
| Methionine | 0mg | 0% | 100% |
N/A
|
| Phenylalanine | 0mg | 0% | 100% |
N/A
|
| Valine | 0mg | 0% | 100% |
N/A
|
| Histidine | 0mg | 0% | 100% |
N/A
|
| Caffeine | 0mg | 0% | 100% | |
| Omega-3 - EPA | 0g | N/A | 100% |
N/A
|
| Omega-3 - DHA | 0g | N/A | 100% |
N/A
|
| Omega-3 - DPA | 0g | N/A | 100% |
N/A
|
Check out similar food or compare with current
NUTRITION FACTS LABEL
Serving Size ______________
Health checks
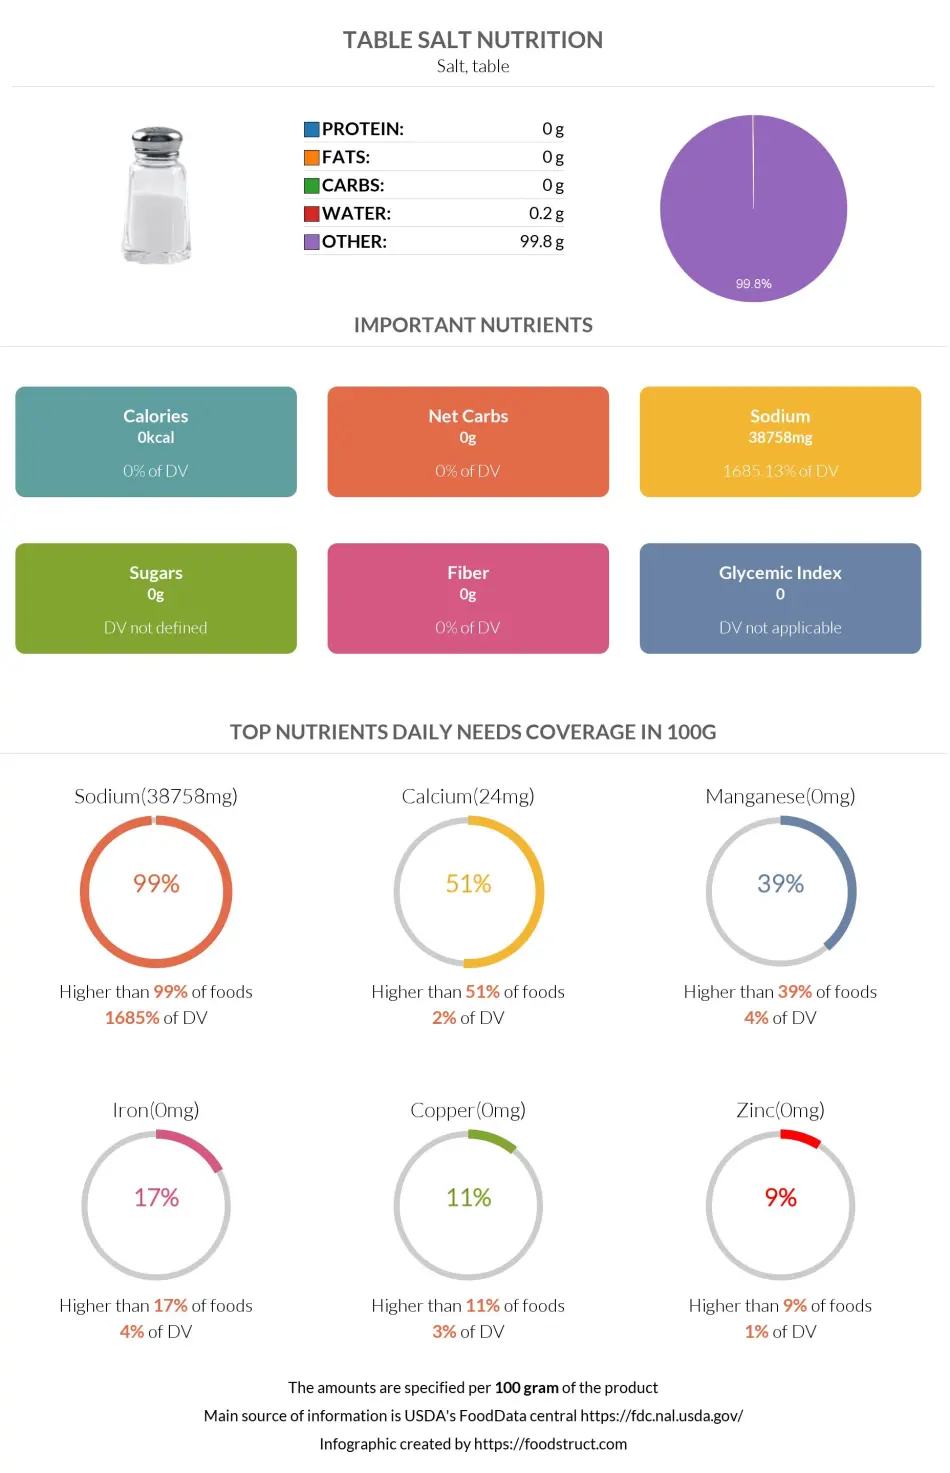
Table salt nutrition infographic
References
All the values for which the sources are not specified explicitly are taken from FDA’s Food Central. The exact link to the food presented on this page can be found below.