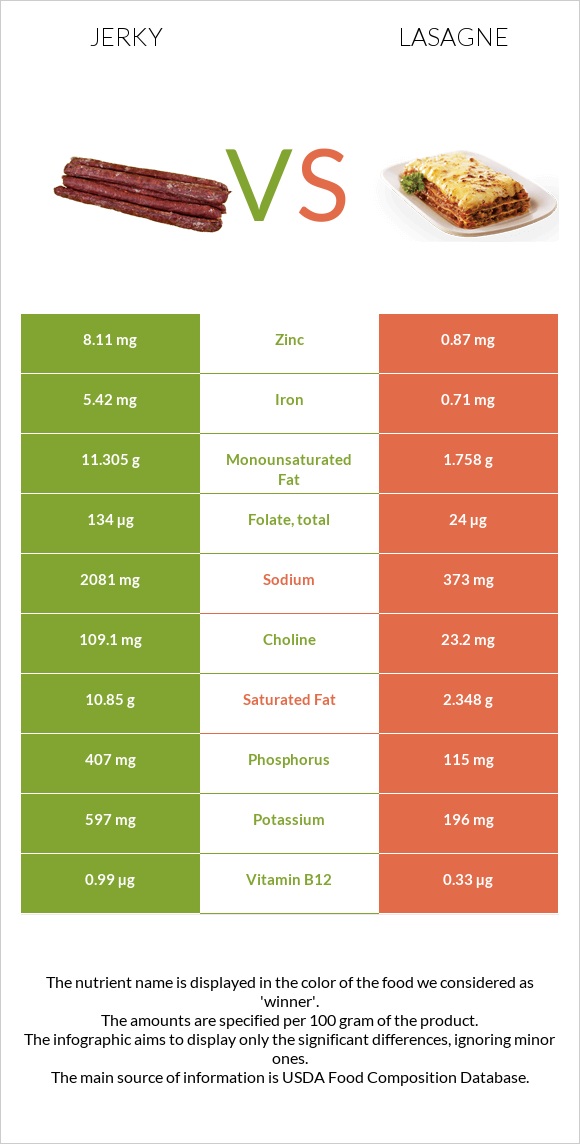
How are jerky and lasagne different? Jerky has more zinc, iron, phosphorus, folate, vitamin B12, choline, copper, and potassium than lasagne. Daily need coverage for sodium for jerky is 74% higher. Jerky contains 9 times more zinc than lasagne. While jerky contains 8.11mg of zinc, lasagne contains only 0.87mg. Lasagne has less sodium. Jerky has a lower glycemic index (0) than lasagne (28). Snacks, beef jerky, chopped, and formed and Lasagna with meat sauce, frozen, prepared are the varieties used in this article.
Infographic
Mineral Comparison
Mineral comparison score is based on the number of minerals by which one or the other food is richer. The "coverage" charts below show how much of the daily needs can be covered by 300 grams of the food.
6
100 g
300 g
1 piece, large - 20g 1 oz - 28.35g 1 oz - 28.35g
Magnesium
Magnesium
Calcium
Calcium
Potassium
Potassium
Iron
Iron
Copper
Copper
Zinc
Zinc
Phosphorus
Phosphorus
Sodium
Sodium
Manganese
Manganese
Selenium
Selenium
36%
6%
53%
203%
76%
221%
174%
271%
14%
58%
4
100 g
300 g
1 piece corner - 114g 1 piece side - 123g 1 piece center - 255g
Magnesium
Magnesium
Calcium
Calcium
Potassium
Potassium
Iron
Iron
Copper
Copper
Zinc
Zinc
Phosphorus
Phosphorus
Sodium
Sodium
Manganese
Manganese
Selenium
Selenium
14%
26%
17%
27%
30%
24%
49%
49%
25%
87%
Vitamin Comparison
Vitamin comparison score is based on the number of vitamins by which one or the other food is richer. The "coverage" charts below show how much of the daily needs can be covered by 300 grams of the food.
7
100 g
300 g
1 piece, large - 20g 1 oz - 28.35g 1 oz - 28.35g
Vitamin C
Vit. C
Vitamin D
Vit. D
Vitamin A
Vit. A
Vitamin E
Vit. E
Vitamin B1
Vit. B1
Vitamin B2
Vit. B2
Vitamin B3
Vit. B3
Vitamin B5
Vit. B5
Vitamin B6
Vit. B6
Vitamin B12
Vit. B12
Vitamin K
Vit. K
Folate
Folate
0%
4.5%
0%
9.8%
39%
33%
32%
9.8%
41%
124%
5.8%
101%
5
100 g
300 g
1 piece corner - 114g 1 piece side - 123g 1 piece center - 255g
Vitamin C
Vit. C
Vitamin D
Vit. D
Vitamin A
Vit. A
Vitamin E
Vit. E
Vitamin B1
Vit. B1
Vitamin B2
Vit. B2
Vitamin B3
Vit. B3
Vitamin B5
Vit. B5
Vitamin B6
Vit. B6
Vitamin B12
Vit. B12
Vitamin K
Vit. K
Folate
Folate
8.3%
0%
14%
17%
18%
17%
29%
19%
28%
41%
18%
18%
All nutrients comparison - raw data values
Nutrient
DV% diff.
Sodium
2081mg
373mg
74%
Zinc
8.11mg
0.87mg
66%
Iron
5.42mg
0.71mg
59%
Protein
33.2g
7.28g
52%
Phosphorus
407mg
115mg
42%
Saturated fat
10.85g
2.348g
39%
Fats
25.6g
4.92g
32%
Vitamin B12
0.99µg
0.33µg
28%
Folate
134µg
24µg
28%
Monounsaturated fat
11.305g
1.758g
24%
Choline
109.1mg
23.2mg
16%
Copper
0.227mg
0.09mg
15%
Calories
410kcal
135kcal
14%
Potassium
597mg
196mg
12%
Cholesterol
48mg
17mg
10%
Selenium
10.7µg
15.9µg
9%
Magnesium
51mg
20mg
7%
Calcium
20mg
88mg
7%
Vitamin B1
0.154mg
0.07mg
7%
Vitamin A
0µg
41µg
5%
Vitamin B2
0.142mg
0.074mg
5%
Starch
9.83g
4%
Manganese
0.111mg
0.193mg
4%
Vitamin B6
0.179mg
0.122mg
4%
Vitamin K
2.3µg
7µg
4%
Polyunsaturated fat
1.011g
0.433g
4%
Vitamin C
0mg
2.5mg
3%
Vitamin B5
0.163mg
0.323mg
3%
Vitamin D
0.3µg
0µg
2%
Vitamin E
0.49mg
0.85mg
2%
Carbs
11g
15.36g
1%
Vitamin D*
11 IU
1 IU
1%
Vitamin B3
1.732mg
1.528mg
1%
Fructose
1.04g
1%
Protein per 100 calories
8.1g
5.4g
N/A
Calories per 10 g protein
123kcal
185kcal
N/A
Weight per 100 calories
24g
74g
N/A
Unsaturated / Saturated Fat ratio
1.1
0.93
N/A
Net carbs
9.2g
13.66g
N/A
Sugar
9g
3.11g
N/A
Fiber
1.8g
1.7g
0%
Trans fat
0.196g
N/A
Tryptophan
0.085mg
0%
Threonine
0.219mg
0%
Isoleucine
0.224mg
0%
Leucine
0.578mg
0%
Lysine
0.486mg
0%
Methionine
0.164mg
0%
Phenylalanine
0.329mg
0%
Valine
0.285mg
0%
Histidine
0.183mg
0%
Omega-3 - EPA
0g
0.001g
N/A
Omega-3 - ALA
0.026g
N/A
Omega-3 - DPA
0g
0.003g
N/A
Omega-6 - Dihomo-gamma-linoleic acid
0.006g
N/A
Omega-6 - Eicosadienoic acid
0.005g
N/A
Omega-6 - Linoleic acid
0.322g
N/A
Macronutrient Comparison
Macronutrient breakdown side-by-side comparison
3
33%
26%
11%
23%
7%
Protein:
33.2 g
Fats:
25.6 g
Carbs:
11 g
Water:
23.36 g
Other:
6.84 g
2
7%
5%
15%
71%
Protein:
7.28 g
Fats:
4.92 g
Carbs:
15.36 g
Water:
70.87 g
Other:
1.57 g
Contains
more
Protein Protein
+356%
Contains
more
Fats Fats
+420.3%
Contains
more
Other Other
+335.7%
Contains
more
Carbs Carbs
+39.6%
Contains
more
Water Water
+203.4%
Fat Type Comparison
Fat type breakdown side-by-side comparison
2
47%
49%
4%
Saturated fat:
Sat. Fat
10.85 g
Monounsaturated fat:
Mono. Fat
11.305 g
Polyunsaturated fat:
Poly. Fat
1.011 g
1
52%
39%
10%
Saturated fat:
Sat. Fat
2.348 g
Monounsaturated fat:
Mono. Fat
1.758 g
Polyunsaturated fat:
Poly. Fat
0.433 g
Contains
more
Mono. Fat Monounsaturated fat
+543.1%
Contains
more
Poly. Fat Polyunsaturated fat
+133.5%
Contains
less
Sat. Fat Saturated fat
-78.4%