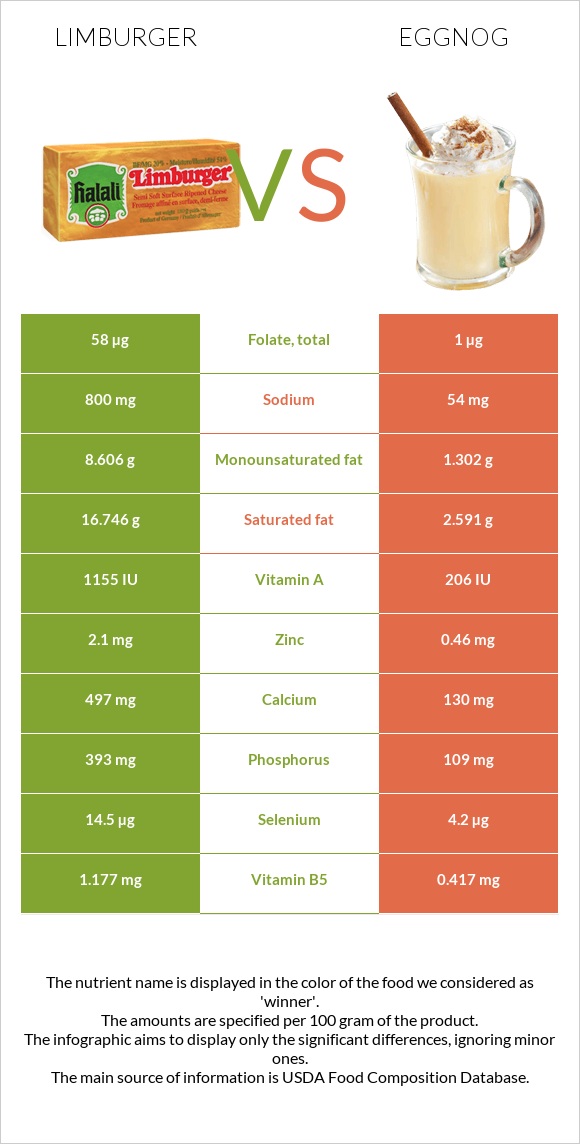
Differences between Limburger and eggnog Eggnog contains less phosphorus, calcium, vitamin B12, vitamin B2, vitamin A, selenium, vitamin B5, and zinc than Limburger. Limburger's daily need coverage for saturated fat is 71% higher. Eggnog contains 15 times less sodium than Limburger. Limburger contains 800mg of sodium, while eggnog contains 54mg. Limburger has a lower glycemic index. The glycemic index of Limburger is 27, while the glycemic index of eggnog is 55. The food types used in this comparison are Cheese, limburger and Eggnog .
Infographic
Mineral Comparison
Mineral comparison score is based on the number of minerals by which one or the other food is richer. The "coverage" charts below show how much of the daily needs can be covered by 300 grams of the food.
6
100 g
300 g
1 cubic inch - 18g 1 oz - 28.35g 1 box - 113g 1 cup - 134g 1 package (8 oz) - 227g
Magnesium
Magnesium
Calcium
Calcium
Potassium
Potassium
Iron
Iron
Copper
Copper
Zinc
Zinc
Phosphorus
Phosphorus
Sodium
Sodium
Manganese
Manganese
Selenium
Selenium
15%
149%
11%
4.9%
7%
57%
168%
104%
5%
79%
3
100 g
300 g
1 fl oz - 31.8g 1 cup - 254g 1 quart - 1016g
Magnesium
Magnesium
Calcium
Calcium
Potassium
Potassium
Iron
Iron
Copper
Copper
Zinc
Zinc
Phosphorus
Phosphorus
Sodium
Sodium
Manganese
Manganese
Selenium
Selenium
14%
39%
15%
7.5%
4.3%
13%
47%
7%
0.65%
23%
Vitamin Comparison
Vitamin comparison score is based on the number of vitamins by which one or the other food is richer. The "coverage" charts below show how much of the daily needs can be covered by 300 grams of the food.
9
100 g
300 g
1 cubic inch - 18g 1 oz - 28.35g 1 box - 113g 1 cup - 134g 1 package (8 oz) - 227g
Vitamin C
Vit. C
Vitamin D
Vit. D
Vitamin A
Vit. A
Vitamin E
Vit. E
Vitamin B1
Vit. B1
Vitamin B2
Vit. B2
Vitamin B3
Vit. B3
Vitamin B5
Vit. B5
Vitamin B6
Vit. B6
Vitamin B12
Vit. B12
Vitamin K
Vit. K
Folate
Folate
0%
7.5%
113%
4.6%
20%
116%
3%
71%
20%
130%
5.8%
44%
2
100 g
300 g
1 fl oz - 31.8g 1 cup - 254g 1 quart - 1016g
Vitamin C
Vit. C
Vitamin D
Vit. D
Vitamin A
Vit. A
Vitamin E
Vit. E
Vitamin B1
Vit. B1
Vitamin B2
Vit. B2
Vitamin B3
Vit. B3
Vitamin B5
Vit. B5
Vitamin B6
Vit. B6
Vitamin B12
Vit. B12
Vitamin K
Vit. K
Folate
Folate
5%
18%
20%
4.2%
8.5%
44%
2%
25%
12%
56%
0.75%
0.75%
All nutrients comparison - raw data values
Nutrient
DV% diff.
Saturated fat
16.746g
2.591g
64%
Phosphorus
393mg
109mg
41%
Calcium
497mg
130mg
37%
Fats
27.25g
4.19g
35%
Sodium
800mg
54mg
32%
Protein
20.05g
4.55g
31%
Vitamin A
340µg
59µg
31%
Vitamin B12
1.04µg
0.45µg
25%
Vitamin B2
0.503mg
0.19mg
24%
Selenium
14.5µg
4.2µg
19%
Monounsaturated fat
8.606g
1.302g
18%
Zinc
2.1mg
0.46mg
15%
Vitamin B5
1.177mg
0.417mg
15%
Folate
58µg
1µg
14%
Calories
327kcal
88kcal
12%
Cholesterol
90mg
59mg
10%
Choline
15.4mg
52.2mg
7%
Vitamin D*
20 IU
49 IU
4%
Vitamin D
0.5µg
1.2µg
4%
Vitamin B1
0.08mg
0.034mg
4%
Carbs
0.49g
8.05g
3%
Vitamin B6
0.086mg
0.05mg
3%
Vitamin C
0mg
1.5mg
2%
Vitamin K
2.3µg
0.3µg
2%
Polyunsaturated fat
0.495g
0.198g
2%
Potassium
128mg
165mg
1%
Iron
0.13mg
0.2mg
1%
Copper
0.021mg
0.013mg
1%
Manganese
0.038mg
0.005mg
1%
Protein per 100 calories
6.1g
5.2g
N/A
Calories per 10 g protein
163kcal
193kcal
N/A
Weight per 100 calories
31g
114g
N/A
Unsaturated / Saturated Fat ratio
0.54
0.58
N/A
Net carbs
0.49g
8.05g
N/A
Magnesium
21mg
19mg
0%
Sugar
0.49g
8.05g
N/A
Vitamin E
0.23mg
0.21mg
0%
Vitamin B3
0.158mg
0.105mg
0%
Tryptophan
0.289mg
0.085mg
0%
Threonine
0.739mg
0.201mg
0%
Isoleucine
1.219mg
0.237mg
0%
Leucine
2.093mg
0.383mg
0%
Lysine
1.675mg
0.257mg
0%
Methionine
0.619mg
0.12mg
0%
Phenylalanine
1.116mg
0.225mg
0%
Valine
1.439mg
0.289mg
0%
Histidine
0.578mg
0.108mg
0%
Fructose
0.04g
0%
Macronutrient Comparison
Macronutrient breakdown side-by-side comparison
3
20%
27%
48%
4%
Protein:
20.05 g
Fats:
27.25 g
Carbs:
0.49 g
Water:
48.42 g
Other:
3.79 g
2
5%
4%
8%
83%
Protein:
4.55 g
Fats:
4.19 g
Carbs:
8.05 g
Water:
82.54 g
Other:
0.67 g
Contains
more
Protein Protein
+340.7%
Contains
more
Fats Fats
+550.4%
Contains
more
Other Other
+465.7%
Contains
more
Carbs Carbs
+1542.9%
Contains
more
Water Water
+70.5%
Fat Type Comparison
Fat type breakdown side-by-side comparison
2
65%
33%
2%
Saturated fat:
Sat. Fat
16.746 g
Monounsaturated fat:
Mono. Fat
8.606 g
Polyunsaturated fat:
Poly. Fat
0.495 g
1
63%
32%
5%
Saturated fat:
Sat. Fat
2.591 g
Monounsaturated fat:
Mono. Fat
1.302 g
Polyunsaturated fat:
Poly. Fat
0.198 g
Contains
more
Mono. Fat Monounsaturated fat
+561%
Contains
more
Poly. Fat Polyunsaturated fat
+150%
Contains
less
Sat. Fat Saturated fat
-84.5%