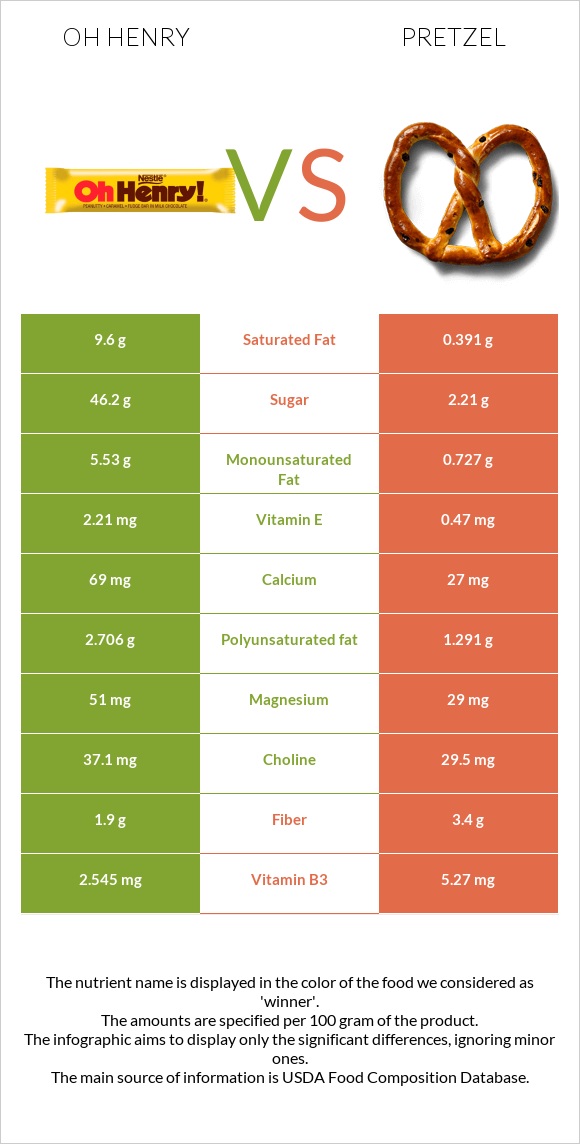
A recap on the differences between oh henry and pretzel Oh henry is higher in copper and vitamin E, yet pretzel is higher in iron, folate, vitamin B1, manganese, vitamin B3, and vitamin B2. Pretzel covers your daily iron needs 51% more than oh henry. Oh henry contains 25 times more saturated fat than pretzel. While oh henry contains 9.6g of saturated fat, pretzel contains only 0.391g. Food varieties used in this article are Candies, NESTLE, OH HENRY! Bar and Snacks, pretzels, hard, plain, salted .
Infographic
Mineral Comparison
Mineral comparison score is based on the number of minerals by which one or the other food is richer. The "coverage" charts below show how much of the daily needs can be covered by 300 grams of the food.
6
100 g
300 g
1 serving fun size bar - 26g 1 bar 2 oz - 57g
Magnesium
Magnesium
Calcium
Calcium
Potassium
Potassium
Iron
Iron
Copper
Copper
Zinc
Zinc
Phosphorus
Phosphorus
Sodium
Sodium
Manganese
Manganese
Selenium
Selenium
36%
21%
23%
19%
118%
32%
60%
25%
70%
17%
3
100 g
300 g
1 oz - 28.35g 10 twists - 60g
Magnesium
Magnesium
Calcium
Calcium
Potassium
Potassium
Iron
Iron
Copper
Copper
Zinc
Zinc
Phosphorus
Phosphorus
Sodium
Sodium
Manganese
Manganese
Selenium
Selenium
21%
8.1%
20%
172%
52%
28%
55%
162%
132%
24%
Vitamin Comparison
Vitamin comparison score is based on the number of vitamins by which one or the other food is richer. The "coverage" charts below show how much of the daily needs can be covered by 300 grams of the food.
4
100 g
300 g
1 serving fun size bar - 26g 1 bar 2 oz - 57g
Vitamin C
Vit. C
Vitamin D
Vit. D
Vitamin A
Vit. A
Vitamin E
Vit. E
Vitamin B1
Vit. B1
Vitamin B2
Vit. B2
Vitamin B3
Vit. B3
Vitamin B5
Vit. B5
Vitamin B6
Vit. B6
Vitamin B12
Vit. B12
Vitamin K
Vit. K
Folate
Folate
0%
0%
0%
44%
37%
28%
48%
32%
20%
25%
3%
33%
6
100 g
300 g
1 oz - 28.35g 10 twists - 60g
Vitamin C
Vit. C
Vitamin D
Vit. D
Vitamin A
Vit. A
Vitamin E
Vit. E
Vitamin B1
Vit. B1
Vitamin B2
Vit. B2
Vitamin B3
Vit. B3
Vitamin B5
Vit. B5
Vitamin B6
Vit. B6
Vitamin B12
Vit. B12
Vitamin K
Vit. K
Folate
Folate
7%
0%
0%
9.4%
106%
77%
99%
19%
17%
0%
7%
125%
All nutrients comparison - raw data values
Nutrient
DV% diff.
Iron
0.5mg
4.58mg
51%
Sodium
193mg
1240mg
46%
Saturated fat
9.6g
0.391g
42%
Fats
23g
2.93g
31%
Folate
44µg
166µg
31%
Starch
72.58g
30%
Vitamin B1
0.149mg
0.424mg
23%
Copper
0.353mg
0.156mg
22%
Manganese
0.535mg
1.015mg
21%
Vitamin B3
2.545mg
5.27mg
17%
Vitamin B2
0.121mg
0.332mg
16%
Vitamin E
2.21mg
0.47mg
12%
Monounsaturated fat
5.53g
0.727g
12%
Polyunsaturated fat
2.706g
1.291g
9%
Vitamin B12
0.2µg
0µg
8%
Fiber
1.9g
3.4g
6%
Protein
7.7g
10.04g
5%
Carbs
65.5g
80.39g
5%
Magnesium
51mg
29mg
5%
Calories
462kcal
384kcal
4%
Calcium
69mg
27mg
4%
Vitamin B5
0.539mg
0.322mg
4%
Vitamin C
0mg
2.1mg
2%
Cholesterol
7mg
0mg
2%
Phosphorus
140mg
128mg
2%
Selenium
3.2µg
4.4µg
2%
Potassium
259mg
223mg
1%
Zinc
1.19mg
1.04mg
1%
Vitamin B6
0.086mg
0.074mg
1%
Vitamin K
1.2µg
2.8µg
1%
Choline
37.1mg
29.5mg
1%
Caffeine
4mg
0mg
1%
Protein per 100 calories
1.7g
2.6g
N/A
Calories per 10 g protein
600kcal
382kcal
N/A
Weight per 100 calories
22g
26g
N/A
Unsaturated / Saturated Fat ratio
0.86
5.2
N/A
Net carbs
63.6g
76.99g
N/A
Sugar
46.2g
2.21g
N/A
Trans fat
0.05g
0.004g
N/A
Tryptophan
0.097mg
0%
Threonine
0.25mg
0%
Isoleucine
0.407mg
0%
Leucine
0.757mg
0%
Lysine
0.257mg
0%
Methionine
0.177mg
0%
Phenylalanine
0.52mg
0%
Valine
0.48mg
0%
Histidine
0.22mg
0%
Fructose
0.31g
0%
Omega-3 - ALA
0.063g
N/A
Omega-6 - Gamma-linoleic acid
0.001g
N/A
Omega-6 - Linoleic acid
1.223g
N/A
Macronutrient Comparison
Macronutrient breakdown side-by-side comparison
1
8%
23%
66%
2%
Protein:
7.7 g
Fats:
23 g
Carbs:
65.5 g
Water:
2.3 g
Other:
1.5 g
4
10%
3%
80%
3%
4%
Protein:
10.04 g
Fats:
2.93 g
Carbs:
80.39 g
Water:
3.13 g
Other:
3.51 g
Contains
more
Fats Fats
+685%
Contains
more
Protein Protein
+30.4%
Contains
more
Carbs Carbs
+22.7%
Contains
more
Water Water
+36.1%
Contains
more
Other Other
+134%
Fat Type Comparison
Fat type breakdown side-by-side comparison
2
54%
31%
15%
Saturated fat:
Sat. Fat
9.6 g
Monounsaturated fat:
Mono. Fat
5.53 g
Polyunsaturated fat:
Poly. Fat
2.706 g
1
16%
30%
54%
Saturated fat:
Sat. Fat
0.391 g
Monounsaturated fat:
Mono. Fat
0.727 g
Polyunsaturated fat:
Poly. Fat
1.291 g
Contains
more
Mono. Fat Monounsaturated fat
+660.7%
Contains
more
Poly. Fat Polyunsaturated fat
+109.6%
Contains
less
Sat. Fat Saturated fat
-95.9%