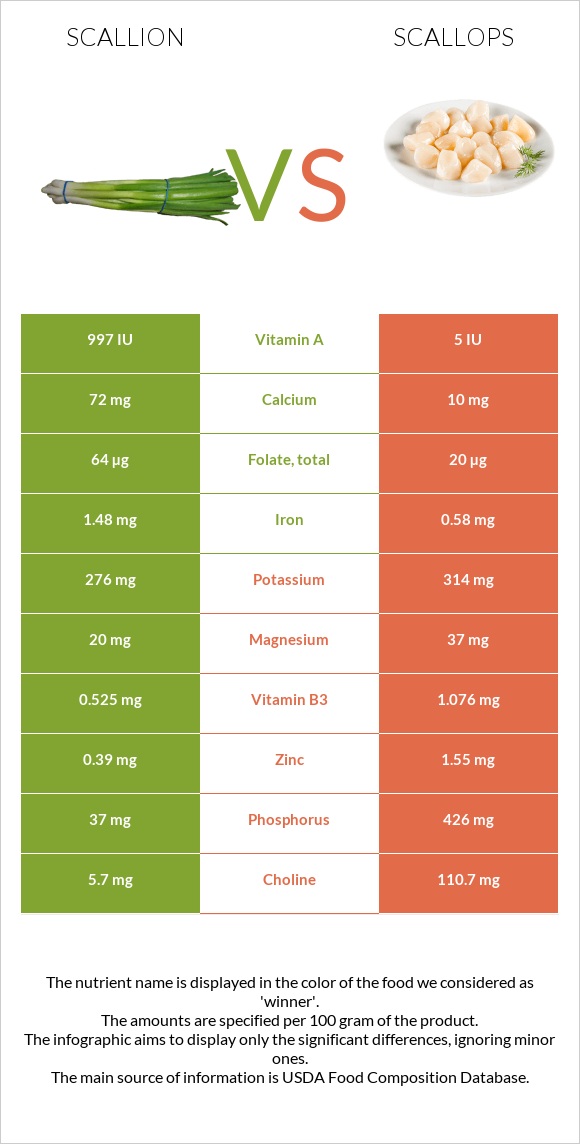
Differences between scallions and scallops Scallions are higher in vitamin K, vitamin C, vitamin A, and iron; however, scallops are richer in vitamin B12, phosphorus, selenium, and choline. Scallions' daily need coverage for vitamin K is 173% higher. Scallions have less sodium. The food types used in this comparison are Onions, spring or scallions (includes tops and bulb), raw and Mollusks, scallop, (bay and sea), cooked, steamed .
Infographic
Mineral Comparison
Mineral comparison score is based on the number of minerals by which one or the other food is richer. The "coverage" charts below show how much of the daily needs can be covered by 300 grams of the food.
5
100 g
300 g
1 small (3" long) - 5g 1 tbsp chopped - 6g 1 medium (4-1/8" long) - 15g 1 large - 25g
Magnesium
Magnesium
Calcium
Calcium
Potassium
Potassium
Iron
Iron
Copper
Copper
Zinc
Zinc
Phosphorus
Phosphorus
Sodium
Sodium
Manganese
Manganese
Selenium
Selenium
14%
22%
24%
56%
28%
11%
16%
2.1%
21%
3.3%
5
100 g
300 g
3 oz - 85g
Magnesium
Magnesium
Calcium
Calcium
Potassium
Potassium
Iron
Iron
Copper
Copper
Zinc
Zinc
Phosphorus
Phosphorus
Sodium
Sodium
Manganese
Manganese
Selenium
Selenium
26%
3%
28%
22%
11%
42%
183%
87%
3.8%
118%
Vitamin Comparison
Vitamin comparison score is based on the number of vitamins by which one or the other food is richer. The "coverage" charts below show how much of the daily needs can be covered by 300 grams of the food.
7
100 g
300 g
1 small (3" long) - 5g 1 tbsp chopped - 6g 1 medium (4-1/8" long) - 15g 1 large - 25g
Vitamin C
Vit. C
Vitamin D
Vit. D
Vitamin A
Vit. A
Vitamin E
Vit. E
Vitamin B1
Vit. B1
Vitamin B2
Vit. B2
Vitamin B3
Vit. B3
Vitamin B5
Vit. B5
Vitamin B6
Vit. B6
Vitamin B12
Vit. B12
Vitamin K
Vit. K
Folate
Folate
63%
0%
17%
11%
14%
18%
9.8%
4.5%
14%
0%
518%
48%
4
100 g
300 g
3 oz - 85g
Vitamin C
Vit. C
Vitamin D
Vit. D
Vitamin A
Vit. A
Vitamin E
Vit. E
Vitamin B1
Vit. B1
Vitamin B2
Vit. B2
Vitamin B3
Vit. B3
Vitamin B5
Vit. B5
Vitamin B6
Vit. B6
Vitamin B12
Vit. B12
Vitamin K
Vit. K
Folate
Folate
0%
0%
0.67%
0%
3%
5.5%
20%
22%
26%
269%
0%
15%
All nutrients comparison - raw data values
Nutrient
DV% diff.
Vitamin K
207µg
0µg
173%
Vitamin B12
0µg
2.15µg
90%
Phosphorus
37mg
426mg
56%
Selenium
0.6µg
21.7µg
38%
Protein
1.83g
20.54g
37%
Sodium
16mg
667mg
28%
Vitamin C
18.8mg
0mg
21%
Choline
5.7mg
110.7mg
19%
Cholesterol
0mg
41mg
14%
Iron
1.48mg
0.58mg
11%
Zinc
0.39mg
1.55mg
11%
Folate
64µg
20µg
11%
Fiber
2.6g
0g
10%
Calcium
72mg
10mg
6%
Copper
0.083mg
0.033mg
6%
Manganese
0.16mg
0.029mg
6%
Vitamin B5
0.075mg
0.366mg
6%
Vitamin A
50µg
2µg
5%
Calories
32kcal
111kcal
4%
Magnesium
20mg
37mg
4%
Vitamin E
0.55mg
0mg
4%
Vitamin B1
0.055mg
0.012mg
4%
Vitamin B2
0.08mg
0.024mg
4%
Vitamin B6
0.061mg
0.112mg
4%
Vitamin B3
0.525mg
1.076mg
3%
Starch
3.69g
2%
Fats
0.19g
0.84g
1%
Carbs
7.34g
5.41g
1%
Potassium
276mg
314mg
1%
Saturated fat
0.032g
0.218g
1%
Polyunsaturated fat
0.074g
0.222g
1%
Protein per 100 calories
5.7g
19g
N/A
Calories per 10 g protein
175kcal
54kcal
N/A
Weight per 100 calories
313g
90g
N/A
Net carbs
4.74g
5.41g
N/A
Vitamin D*
0 IU
2 IU
0%
Sugar
2.33g
0g
N/A
Trans fat
0g
0.009g
N/A
Monounsaturated fat
0.027g
0.082g
0%
Tryptophan
0.02mg
0.173mg
0%
Threonine
0.072mg
0.629mg
0%
Isoleucine
0.077mg
0.692mg
0%
Leucine
0.109mg
1.226mg
0%
Lysine
0.091mg
1.258mg
0%
Methionine
0.02mg
0.487mg
0%
Phenylalanine
0.059mg
0.597mg
0%
Valine
0.081mg
0.645mg
0%
Histidine
0.032mg
0.314mg
0%
Omega-3 - EPA
0g
0.072g
N/A
Omega-3 - DHA
0g
0.104g
N/A
Omega-3 - DPA
0g
0.005g
N/A
Omega-6 - Eicosadienoic acid
0.002g
N/A
Macronutrient Comparison
Macronutrient breakdown side-by-side comparison
2
2%
7%
90%
Protein:
1.83 g
Fats:
0.19 g
Carbs:
7.34 g
Water:
89.83 g
Other:
0.81 g
3
21%
5%
70%
3%
Protein:
20.54 g
Fats:
0.84 g
Carbs:
5.41 g
Water:
70.25 g
Other:
2.96 g
Contains
more
Carbs Carbs
+35.7%
Contains
more
Water Water
+27.9%
Contains
more
Protein Protein
+1022.4%
Contains
more
Fats Fats
+342.1%
Contains
more
Other Other
+265.4%
Fat Type Comparison
Fat type breakdown side-by-side comparison
1
24%
20%
56%
Saturated fat:
Sat. Fat
0.032 g
Monounsaturated fat:
Mono. Fat
0.027 g
Polyunsaturated fat:
Poly. Fat
0.074 g
2
42%
16%
43%
Saturated fat:
Sat. Fat
0.218 g
Monounsaturated fat:
Mono. Fat
0.082 g
Polyunsaturated fat:
Poly. Fat
0.222 g
Contains
less
Sat. Fat Saturated fat
-85.3%
Contains
more
Mono. Fat Monounsaturated fat
+203.7%
Contains
more
Poly. Fat Polyunsaturated fat
+200%