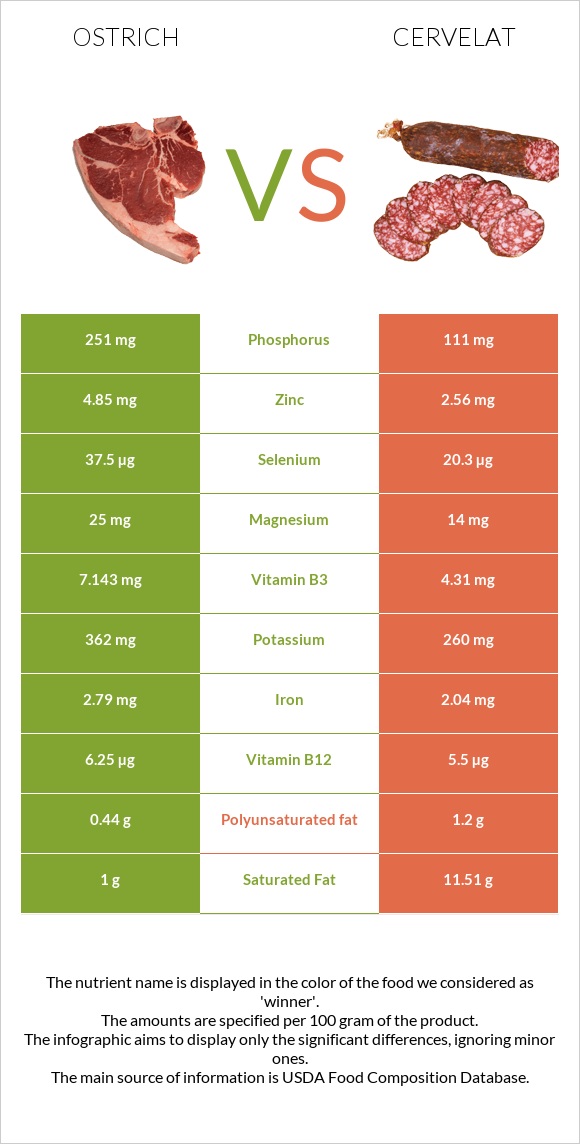
The main differences between ostrich and cervelat Ostrich is richer in selenium, vitamin B12, vitamin B6, zinc, phosphorus, vitamin B3, and iron, yet cervelat is richer in vitamin C. Daily need coverage for sodium for cervelat is 53% higher. Ostrich contains 2 times more phosphorus than cervelat. Ostrich contains 251mg of phosphorus, while cervelat contains 111mg. Ostrich contains less saturated fat. Ostrich has a lower glycemic index than cervelat. Food types used in this article are Ostrich, tip trimmed, cooked and Thuringer, cervelat, summer sausage, beef, pork .
Infographic
Mineral Comparison
Mineral comparison score is based on the number of minerals by which one or the other food is richer. The "coverage" charts below show how much of the daily needs can be covered by 300 grams of the food.
8
100 g
300 g
1 serving ( 3 oz ) - 85g
Magnesium
Magnesium
Calcium
Calcium
Potassium
Potassium
Iron
Iron
Copper
Copper
Zinc
Zinc
Phosphorus
Phosphorus
Sodium
Sodium
Manganese
Manganese
Selenium
Selenium
18%
1.8%
32%
105%
51%
132%
108%
10%
2.5%
205%
1
100 g
300 g
2 oz 1 serving - 56g
Magnesium
Magnesium
Calcium
Calcium
Potassium
Potassium
Iron
Iron
Copper
Copper
Zinc
Zinc
Phosphorus
Phosphorus
Sodium
Sodium
Manganese
Manganese
Selenium
Selenium
10%
2.7%
23%
77%
50%
70%
48%
170%
0%
111%
Vitamin Comparison
Vitamin comparison score is based on the number of vitamins by which one or the other food is richer. The "coverage" charts below show how much of the daily needs can be covered by 300 grams of the food.
6
100 g
300 g
1 serving ( 3 oz ) - 85g
Vitamin C
Vit. C
Vitamin D
Vit. D
Vitamin A
Vit. A
Vitamin E
Vit. E
Vitamin B1
Vit. B1
Vitamin B2
Vit. B2
Vitamin B3
Vit. B3
Vitamin B5
Vit. B5
Vitamin B6
Vit. B6
Vitamin B12
Vit. B12
Vitamin K
Vit. K
Folate
Folate
0%
0%
0%
4.6%
58%
67%
134%
79%
126%
781%
0%
11%
4
100 g
300 g
2 oz 1 serving - 56g
Vitamin C
Vit. C
Vitamin D
Vit. D
Vitamin A
Vit. A
Vitamin E
Vit. E
Vitamin B1
Vit. B1
Vitamin B2
Vit. B2
Vitamin B3
Vit. B3
Vitamin B5
Vit. B5
Vitamin B6
Vit. B6
Vitamin B12
Vit. B12
Vitamin K
Vit. K
Folate
Folate
55%
17%
0%
4.4%
38%
76%
81%
0%
60%
688%
3.3%
1.5%
All nutrients comparison - raw data values
Nutrient
DV% diff.
Sodium
80mg
1300mg
53%
Saturated fat
1g
11.51g
48%
Fats
2.57g
30.43g
43%
Selenium
37.5µg
20.3µg
31%
Vitamin B12
6.25µg
5.5µg
31%
Monounsaturated fat
0.97g
12.97g
30%
Vitamin B5
1.318mg
26%
Protein
28.49g
17.45g
22%
Vitamin B6
0.545mg
0.26mg
22%
Zinc
4.85mg
2.56mg
21%
Phosphorus
251mg
111mg
20%
Vitamin C
0mg
16.6mg
18%
Vitamin B3
7.143mg
4.31mg
18%
Choline
78.9mg
14%
Calories
145kcal
362kcal
11%
Iron
2.79mg
2.04mg
9%
Vitamin B1
0.232mg
0.15mg
7%
Vitamin D*
44 IU
6%
Vitamin D
1.1µg
6%
Polyunsaturated fat
0.44g
1.2g
5%
Cholesterol
85mg
74mg
4%
Magnesium
25mg
14mg
3%
Potassium
362mg
260mg
3%
Vitamin B2
0.292mg
0.33mg
3%
Folate
15µg
2µg
3%
Carbs
0g
3.33g
1%
Manganese
0.019mg
1%
Vitamin K
1.3µg
1%
Protein per 100 calories
20g
4.8g
N/A
Calories per 10 g protein
51kcal
207kcal
N/A
Weight per 100 calories
69g
28g
N/A
Unsaturated / Saturated Fat ratio
1.4
1.2
N/A
Net carbs
0g
3.33g
N/A
Calcium
6mg
9mg
0%
Sugar
0g
0.85g
N/A
Copper
0.152mg
0.15mg
0%
Vitamin E
0.23mg
0.22mg
0%
Tryptophan
0.254mg
0%
Threonine
1.25mg
0%
Isoleucine
1.354mg
0%
Leucine
2.315mg
0%
Lysine
2.516mg
0%
Methionine
0.796mg
0%
Phenylalanine
1.176mg
0%
Valine
1.407mg
0%
Histidine
0.716mg
0%
Macronutrient Comparison
Macronutrient breakdown side-by-side comparison
2
28%
3%
69%
Protein:
28.49 g
Fats:
2.57 g
Carbs:
0 g
Water:
68.51 g
Other:
0.43 g
3
17%
30%
3%
45%
4%
Protein:
17.45 g
Fats:
30.43 g
Carbs:
3.33 g
Water:
45.18 g
Other:
3.61 g
Contains
more
Protein Protein
+63.3%
Contains
more
Water Water
+51.6%
Contains
more
Fats Fats
+1084%
Contains
more
Carbs Carbs
+∞%
Contains
more
Other Other
+739.5%
Fat Type Comparison
Fat type breakdown side-by-side comparison
1
41%
40%
18%
Saturated fat:
Sat. Fat
1 g
Monounsaturated fat:
Mono. Fat
0.97 g
Polyunsaturated fat:
Poly. Fat
0.44 g
2
45%
51%
5%
Saturated fat:
Sat. Fat
11.51 g
Monounsaturated fat:
Mono. Fat
12.97 g
Polyunsaturated fat:
Poly. Fat
1.2 g
Contains
less
Sat. Fat Saturated fat
-91.3%
Contains
more
Mono. Fat Monounsaturated fat
+1237.1%
Contains
more
Poly. Fat Polyunsaturated fat
+172.7%