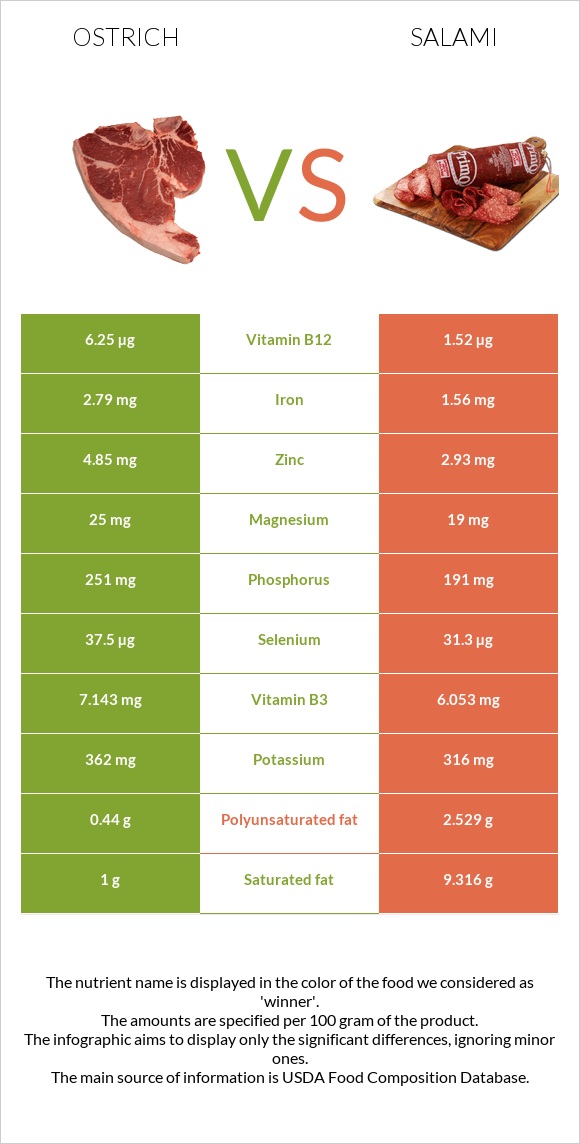
A recap on the differences between ostrich and salami Ostrich is higher in vitamin B12, zinc, iron, selenium, and phosphorus, yet salami is higher in manganese, copper, and vitamin B1. Ostrich covers your daily vitamin B12 needs 197% more than salami. Ostrich contains 2 times more iron than salami. While ostrich contains 2.79mg of iron, salami contains only 1.56mg. The amount of saturated fat in ostrich is lower. The glycemic index of ostrich is lower. Food varieties used in this article are Ostrich, tip trimmed, cooked and Salami, cooked, beef, and pork .
Infographic
Mineral Comparison
Mineral comparison score is based on the number of minerals by which one or the other food is richer. The "coverage" charts below show how much of the daily needs can be covered by 300 grams of the food.
7
100 g
300 g
1 serving ( 3 oz ) - 85g
Magnesium
Magnesium
Calcium
Calcium
Potassium
Potassium
Iron
Iron
Copper
Copper
Zinc
Zinc
Phosphorus
Phosphorus
Sodium
Sodium
Manganese
Manganese
Selenium
Selenium
18%
1.8%
32%
105%
51%
132%
108%
10%
2.5%
205%
3
100 g
300 g
1 slice round - 12.3g
Magnesium
Magnesium
Calcium
Calcium
Potassium
Potassium
Iron
Iron
Copper
Copper
Zinc
Zinc
Phosphorus
Phosphorus
Sodium
Sodium
Manganese
Manganese
Selenium
Selenium
14%
4.5%
28%
59%
119%
80%
82%
227%
128%
171%
Vitamin Comparison
Vitamin comparison score is based on the number of vitamins by which one or the other food is richer. The "coverage" charts below show how much of the daily needs can be covered by 300 grams of the food.
4
100 g
300 g
1 serving ( 3 oz ) - 85g
Vitamin C
Vit. C
Vitamin D
Vit. D
Vitamin A
Vit. A
Vitamin E
Vit. E
Vitamin B1
Vit. B1
Vitamin B2
Vit. B2
Vitamin B3
Vit. B3
Vitamin B5
Vit. B5
Vitamin B6
Vit. B6
Vitamin B12
Vit. B12
Vitamin K
Vit. K
Folate
Folate
0%
0%
0%
4.6%
58%
67%
134%
79%
126%
781%
0%
11%
4
100 g
300 g
1 slice round - 12.3g
Vitamin C
Vit. C
Vitamin D
Vit. D
Vitamin A
Vit. A
Vitamin E
Vit. E
Vitamin B1
Vit. B1
Vitamin B2
Vit. B2
Vitamin B3
Vit. B3
Vitamin B5
Vit. B5
Vitamin B6
Vit. B6
Vitamin B12
Vit. B12
Vitamin K
Vit. K
Folate
Folate
0%
15%
0%
4.4%
92%
82%
113%
72%
106%
190%
8%
2.3%
All nutrients comparison - raw data values
Nutrient
DV% diff.
Vitamin B12
6.25µg
1.52µg
197%
Sodium
80mg
1740mg
72%
Manganese
0.019mg
0.978mg
42%
Saturated fat
1g
9.316g
38%
Fats
2.57g
25.9g
36%
Monounsaturated fat
0.97g
11.127g
25%
Copper
0.152mg
0.357mg
23%
Zinc
4.85mg
2.93mg
17%
Choline
93.5mg
17%
Iron
2.79mg
1.56mg
15%
Polyunsaturated fat
0.44g
2.529g
14%
Protein
28.49g
21.85g
13%
Selenium
37.5µg
31.3µg
11%
Vitamin B1
0.232mg
0.367mg
11%
Calories
145kcal
336kcal
10%
Phosphorus
251mg
191mg
9%
Vitamin B3
7.143mg
6.053mg
7%
Vitamin B6
0.545mg
0.459mg
7%
Vitamin D*
41 IU
5%
Vitamin D
1µg
5%
Vitamin B2
0.292mg
0.357mg
5%
Vitamin K
3.2µg
3%
Folate
15µg
3µg
3%
Vitamin B5
1.318mg
1.201mg
2%
Carbs
0g
2.4g
1%
Cholesterol
85mg
89mg
1%
Magnesium
25mg
19mg
1%
Calcium
6mg
15mg
1%
Potassium
362mg
316mg
1%
Protein per 100 calories
20g
6.5g
N/A
Calories per 10 g protein
51kcal
154kcal
N/A
Weight per 100 calories
69g
30g
N/A
Unsaturated / Saturated Fat ratio
1.4
1.5
N/A
Net carbs
0g
2.4g
N/A
Sugar
0g
0.96g
N/A
Vitamin E
0.23mg
0.22mg
0%
Trans fat
0.586g
N/A
Tryptophan
0.254mg
0.114mg
0%
Threonine
1.25mg
0.521mg
0%
Isoleucine
1.354mg
0.675mg
0%
Leucine
2.315mg
0.929mg
0%
Lysine
2.516mg
1.107mg
0%
Methionine
0.796mg
0.301mg
0%
Phenylalanine
1.176mg
0.481mg
0%
Valine
1.407mg
0.668mg
0%
Histidine
0.716mg
0.359mg
0%
Omega-3 - ALA
0.126g
N/A
Omega-6 - Eicosadienoic acid
0.084g
N/A
Omega-6 - Linoleic acid
2.104g
N/A
Macronutrient Comparison
Macronutrient breakdown side-by-side comparison
2
28%
3%
69%
Protein:
28.49 g
Fats:
2.57 g
Carbs:
0 g
Water:
68.51 g
Other:
0.43 g
3
22%
26%
2%
45%
5%
Protein:
21.85 g
Fats:
25.9 g
Carbs:
2.4 g
Water:
45.19 g
Other:
4.66 g
Contains
more
Protein Protein
+30.4%
Contains
more
Water Water
+51.6%
Contains
more
Fats Fats
+907.8%
Contains
more
Carbs Carbs
+∞%
Contains
more
Other Other
+983.7%
Fat Type Comparison
Fat type breakdown side-by-side comparison
1
41%
40%
18%
Saturated fat:
Sat. Fat
1 g
Monounsaturated fat:
Mono. Fat
0.97 g
Polyunsaturated fat:
Poly. Fat
0.44 g
2
41%
48%
11%
Saturated fat:
Sat. Fat
9.316 g
Monounsaturated fat:
Mono. Fat
11.127 g
Polyunsaturated fat:
Poly. Fat
2.529 g
Contains
less
Sat. Fat Saturated fat
-89.3%
Contains
more
Mono. Fat Monounsaturated fat
+1047.1%
Contains
more
Poly. Fat Polyunsaturated fat
+474.8%