Summary of differences between peach and pretzel Peach has less iron, manganese, folate, vitamin B1, vitamin B3, vitamin B2, phosphorus, copper, and zinc than pretzel. Pretzel covers your daily need for iron, 54% more than peach. The glycemic index of pretzel is higher. These are the specific foods used in this comparison Peaches, yellow, raw and Snacks, pretzels, hard, plain, salted .
Infographic
Mineral Comparison
Mineral comparison score is based on the number of minerals by which one or the other food is richer. The "coverage" charts below show how much of the daily needs can be covered by 300 grams of the food.
1
100 g
300 g
1 small (2-1/2" dia) - 130g 1 NLEA serving - 147g 1 medium (2-2/3" dia) - 150g 1 cup slices - 154g 1 large (2-3/4" dia) - 175g 1 extra large (3" dia) - 224g
Magnesium
Magnesium
Calcium
Calcium
Potassium
Potassium
Iron
Iron
Copper
Copper
Zinc
Zinc
Phosphorus
Phosphorus
Sodium
Sodium
Manganese
Manganese
Selenium
Selenium
6.4%
1.8%
17%
9.4%
23%
4.6%
8.6%
0%
8%
0.55%
9
100 g
300 g
1 oz - 28.35g 10 twists - 60g
Magnesium
Magnesium
Calcium
Calcium
Potassium
Potassium
Iron
Iron
Copper
Copper
Zinc
Zinc
Phosphorus
Phosphorus
Sodium
Sodium
Manganese
Manganese
Selenium
Selenium
21%
8.1%
20%
172%
52%
28%
55%
162%
132%
24%
Vitamin Comparison
Vitamin comparison score is based on the number of vitamins by which one or the other food is richer. The "coverage" charts below show how much of the daily needs can be covered by 300 grams of the food.
3
100 g
300 g
1 small (2-1/2" dia) - 130g 1 NLEA serving - 147g 1 medium (2-2/3" dia) - 150g 1 cup slices - 154g 1 large (2-3/4" dia) - 175g 1 extra large (3" dia) - 224g
Vitamin C
Vit. C
Vitamin D
Vit. D
Vitamin A
Vit. A
Vitamin E
Vit. E
Vitamin B1
Vit. B1
Vitamin B2
Vit. B2
Vitamin B3
Vit. B3
Vitamin B5
Vit. B5
Vitamin B6
Vit. B6
Vitamin B12
Vit. B12
Vitamin K
Vit. K
Folate
Folate
22%
0%
5.3%
15%
6%
7.2%
15%
9.2%
5.8%
0%
6.5%
3%
6
100 g
300 g
1 oz - 28.35g 10 twists - 60g
Vitamin C
Vit. C
Vitamin D
Vit. D
Vitamin A
Vit. A
Vitamin E
Vit. E
Vitamin B1
Vit. B1
Vitamin B2
Vit. B2
Vitamin B3
Vit. B3
Vitamin B5
Vit. B5
Vitamin B6
Vit. B6
Vitamin B12
Vit. B12
Vitamin K
Vit. K
Folate
Folate
7%
0%
0%
9.4%
106%
77%
99%
19%
17%
0%
7%
125%
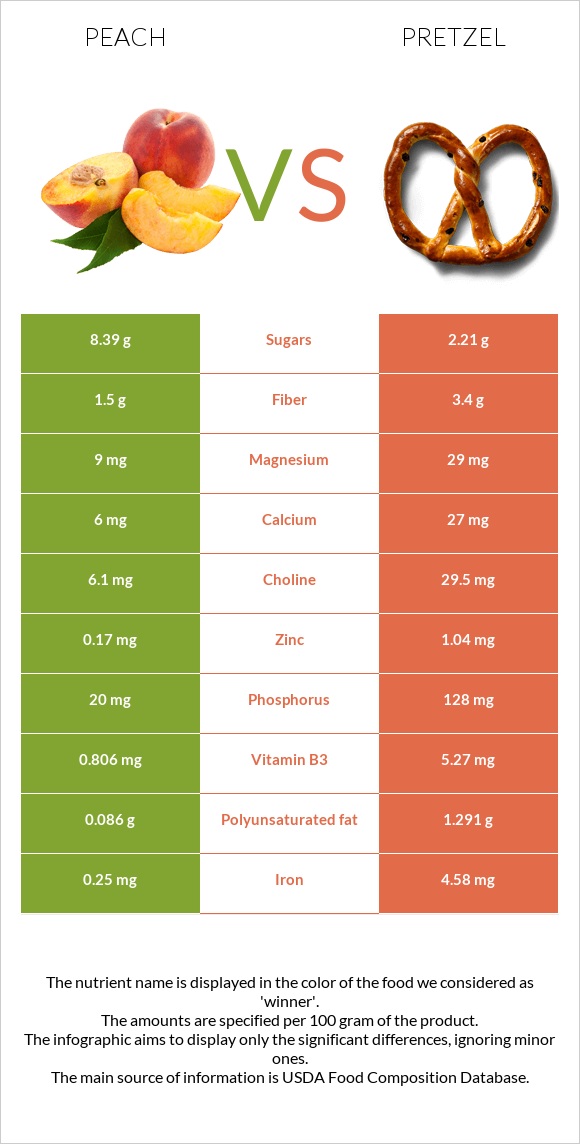
All nutrients comparison - raw data values
Nutrient
DV% diff.
Iron
0.25mg
4.58mg
54%
Sodium
0mg
1240mg
54%
Manganese
0.061mg
1.015mg
41%
Folate
4µg
166µg
41%
Vitamin B1
0.024mg
0.424mg
33%
Starch
0g
72.58g
30%
Vitamin B3
0.806mg
5.27mg
28%
Carbs
9.54g
80.39g
24%
Vitamin B2
0.031mg
0.332mg
23%
Protein
0.91g
10.04g
18%
Calories
39kcal
384kcal
17%
Phosphorus
20mg
128mg
15%
Copper
0.068mg
0.156mg
10%
Fiber
1.5g
3.4g
8%
Zinc
0.17mg
1.04mg
8%
Selenium
0.1µg
4.4µg
8%
Polyunsaturated fat
0.086g
1.291g
8%
Vitamin C
6.6mg
2.1mg
5%
Magnesium
9mg
29mg
5%
Fats
0.25g
2.93g
4%
Vitamin B6
0.025mg
0.074mg
4%
Choline
6.1mg
29.5mg
4%
Vitamin B5
0.153mg
0.322mg
3%
Calcium
6mg
27mg
2%
Vitamin A
16µg
0µg
2%
Vitamin E
0.73mg
0.47mg
2%
Saturated fat
0.019g
0.391g
2%
Monounsaturated fat
0.067g
0.727g
2%
Fructose
1.53g
0.31g
2%
Potassium
190mg
223mg
1%
Protein per 100 calories
2.3g
2.6g
N/A
Calories per 10 g protein
429kcal
382kcal
N/A
Weight per 100 calories
256g
26g
N/A
Unsaturated / Saturated Fat ratio
8.1
5.2
N/A
Net carbs
8.04g
76.99g
N/A
Sugar
8.39g
2.21g
N/A
Vitamin K
2.6µg
2.8µg
0%
Trans fat
0g
0.004g
N/A
Tryptophan
0.01mg
0.097mg
0%
Threonine
0.016mg
0.25mg
0%
Isoleucine
0.017mg
0.407mg
0%
Leucine
0.027mg
0.757mg
0%
Lysine
0.03mg
0.257mg
0%
Methionine
0.01mg
0.177mg
0%
Phenylalanine
0.019mg
0.52mg
0%
Valine
0.022mg
0.48mg
0%
Histidine
0.013mg
0.22mg
0%
Omega-3 - ALA
0.063g
N/A
Omega-6 - Gamma-linoleic acid
0.001g
N/A
Omega-6 - Linoleic acid
1.223g
N/A
Macronutrient Comparison
Macronutrient breakdown side-by-side comparison
1
10%
89%
Protein:
0.91 g
Fats:
0.25 g
Carbs:
9.54 g
Water:
88.87 g
Other:
0.43 g
4
10%
3%
80%
3%
4%
Protein:
10.04 g
Fats:
2.93 g
Carbs:
80.39 g
Water:
3.13 g
Other:
3.51 g
Contains
more
Water Water
+2739.3%
Contains
more
Protein Protein
+1003.3%
Contains
more
Fats Fats
+1072%
Contains
more
Carbs Carbs
+742.7%
Contains
more
Other Other
+716.3%
Fat Type Comparison
Fat type breakdown side-by-side comparison
1
11%
39%
50%
Saturated fat:
Sat. Fat
0.019 g
Monounsaturated fat:
Mono. Fat
0.067 g
Polyunsaturated fat:
Poly. Fat
0.086 g
2
16%
30%
54%
Saturated fat:
Sat. Fat
0.391 g
Monounsaturated fat:
Mono. Fat
0.727 g
Polyunsaturated fat:
Poly. Fat
1.291 g
Contains
less
Sat. Fat Saturated fat
-95.1%
Contains
more
Mono. Fat Monounsaturated fat
+985.1%
Contains
more
Poly. Fat Polyunsaturated fat
+1401.2%
Carbohydrate type comparison
Carbohydrate type breakdown side-by-side comparison
4
57%
23%
18%
Starch:
0 g
Sucrose:
4.76 g
Glucose:
1.95 g
Fructose:
1.53 g
Lactose:
0 g
Maltose:
0.08 g
Galactose:
0.06 g
2
97%
Starch:
72.58 g
Sucrose:
0 g
Glucose:
0.69 g
Fructose:
0.31 g
Lactose:
0 g
Maltose:
1.11 g
Galactose:
0 g
Contains
more
Sucrose Sucrose
+∞%
Contains
more
Glucose Glucose
+182.6%
Contains
more
Fructose Fructose
+393.5%
Contains
more
Galactose Galactose
+∞%
Contains
more
Starch Starch
+∞%
Contains
more
Maltose Maltose
+1287.5%