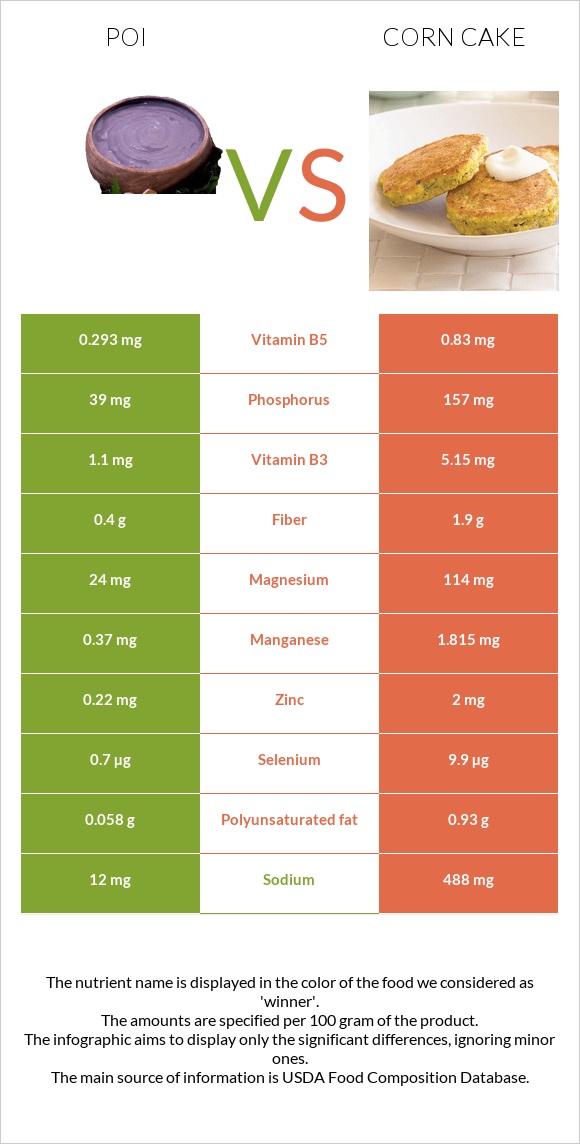
How are poi and corn cake different? Poi has more vitamin B6; however, corn cake is richer in manganese, copper, vitamin B3, magnesium, phosphorus, selenium, zinc, and vitamin B5. Corn cake covers your daily need for manganese, 63% more than poi. Poi has 2 times more vitamin B6 than corn cake. Poi has 0.273mg of vitamin B6, while corn cake has 0.14mg. Poi contains less sodium. Poi and Snacks, corn cakes types were used in this article.
Infographic
Mineral Comparison
Mineral comparison score is based on the number of minerals by which one or the other food is richer. The "coverage" charts below show how much of the daily needs can be covered by 300 grams of the food.
2
100 g
300 g
1 cup - 240g
Magnesium
Magnesium
Calcium
Calcium
Potassium
Potassium
Iron
Iron
Copper
Copper
Zinc
Zinc
Phosphorus
Phosphorus
Sodium
Sodium
Manganese
Manganese
Selenium
Selenium
17%
4.8%
16%
33%
55%
6%
17%
1.6%
48%
3.8%
8
100 g
300 g
1 cake - 9g 2 cakes - 18g
Magnesium
Magnesium
Calcium
Calcium
Potassium
Potassium
Iron
Iron
Copper
Copper
Zinc
Zinc
Phosphorus
Phosphorus
Sodium
Sodium
Manganese
Manganese
Selenium
Selenium
81%
5.7%
14%
53%
140%
55%
67%
64%
237%
54%
Vitamin Comparison
Vitamin comparison score is based on the number of vitamins by which one or the other food is richer. The "coverage" charts below show how much of the daily needs can be covered by 300 grams of the food.
4
100 g
300 g
1 cup - 240g
Vitamin C
Vit. C
Vitamin D
Vit. D
Vitamin A
Vit. A
Vitamin E
Vit. E
Vitamin B1
Vit. B1
Vitamin B2
Vit. B2
Vitamin B3
Vit. B3
Vitamin B5
Vit. B5
Vitamin B6
Vit. B6
Vitamin B12
Vit. B12
Vitamin K
Vit. K
Folate
Folate
13%
0%
1%
46%
33%
9.2%
21%
18%
63%
0%
2.5%
16%
5
100 g
300 g
1 cake - 9g 2 cakes - 18g
Vitamin C
Vit. C
Vitamin D
Vit. D
Vitamin A
Vit. A
Vitamin E
Vit. E
Vitamin B1
Vit. B1
Vitamin B2
Vit. B2
Vitamin B3
Vit. B3
Vitamin B5
Vit. B5
Vitamin B6
Vit. B6
Vitamin B12
Vit. B12
Vitamin K
Vit. K
Folate
Folate
0%
0%
23%
0%
63%
12%
97%
50%
32%
0%
0%
14%
All nutrients comparison - raw data values
Nutrient
DV% diff.
Manganese
0.37mg
1.815mg
63%
Copper
0.166mg
0.42mg
28%
Vitamin B3
1.1mg
5.15mg
25%
Magnesium
24mg
114mg
21%
Sodium
12mg
488mg
21%
Carbs
27.23g
83.4g
19%
Phosphorus
39mg
157mg
17%
Selenium
0.7µg
9.9µg
17%
Zinc
0.22mg
2mg
16%
Protein
0.38g
8.1g
15%
Vitamin E
2.3mg
15%
Calories
112kcal
387kcal
14%
Vitamin B5
0.293mg
0.83mg
11%
Vitamin B1
0.13mg
0.25mg
10%
Vitamin B6
0.273mg
0.14mg
10%
Iron
0.88mg
1.4mg
7%
Vitamin A
3µg
70µg
7%
Fiber
0.4g
1.9g
6%
Polyunsaturated fat
0.058g
0.93g
6%
Vitamin C
4mg
0mg
4%
Fats
0.14g
2.4g
3%
Choline
16.7mg
3%
Saturated fat
0.029g
0.42g
2%
Monounsaturated fat
0.011g
0.76g
2%
Potassium
183mg
157mg
1%
Vitamin B2
0.04mg
0.05mg
1%
Vitamin K
1µg
0µg
1%
Folate
21µg
19µg
1%
Protein per 100 calories
0.34g
2.1g
N/A
Calories per 10 g protein
2947kcal
478kcal
N/A
Weight per 100 calories
89g
26g
N/A
Unsaturated / Saturated Fat ratio
2.4
4
N/A
Net carbs
26.83g
81.5g
N/A
Calcium
16mg
19mg
0%
Sugar
0.39g
23.47g
N/A
Tryptophan
0.081mg
0%
Threonine
0.301mg
0%
Isoleucine
0.316mg
0%
Leucine
0.837mg
0%
Lysine
0.267mg
0%
Methionine
0.177mg
0%
Phenylalanine
0.408mg
0%
Valine
0.442mg
0%
Histidine
0.227mg
0%
Macronutrient Comparison
Macronutrient breakdown side-by-side comparison
1
27%
72%
Protein:
0.38 g
Fats:
0.14 g
Carbs:
27.23 g
Water:
71.64 g
Other:
0.61 g
4
8%
2%
83%
5%
Protein:
8.1 g
Fats:
2.4 g
Carbs:
83.4 g
Water:
4.6 g
Other:
1.5 g
Contains
more
Water Water
+1457.4%
Contains
more
Protein Protein
+2031.6%
Contains
more
Fats Fats
+1614.3%
Contains
more
Carbs Carbs
+206.3%
Contains
more
Other Other
+145.9%
Fat Type Comparison
Fat type breakdown side-by-side comparison
1
30%
11%
59%
Saturated fat:
Sat. Fat
0.029 g
Monounsaturated fat:
Mono. Fat
0.011 g
Polyunsaturated fat:
Poly. Fat
0.058 g
2
20%
36%
44%
Saturated fat:
Sat. Fat
0.42 g
Monounsaturated fat:
Mono. Fat
0.76 g
Polyunsaturated fat:
Poly. Fat
0.93 g
Contains
less
Sat. Fat Saturated fat
-93.1%
Contains
more
Mono. Fat Monounsaturated fat
+6809.1%
Contains
more
Poly. Fat Polyunsaturated fat
+1503.4%