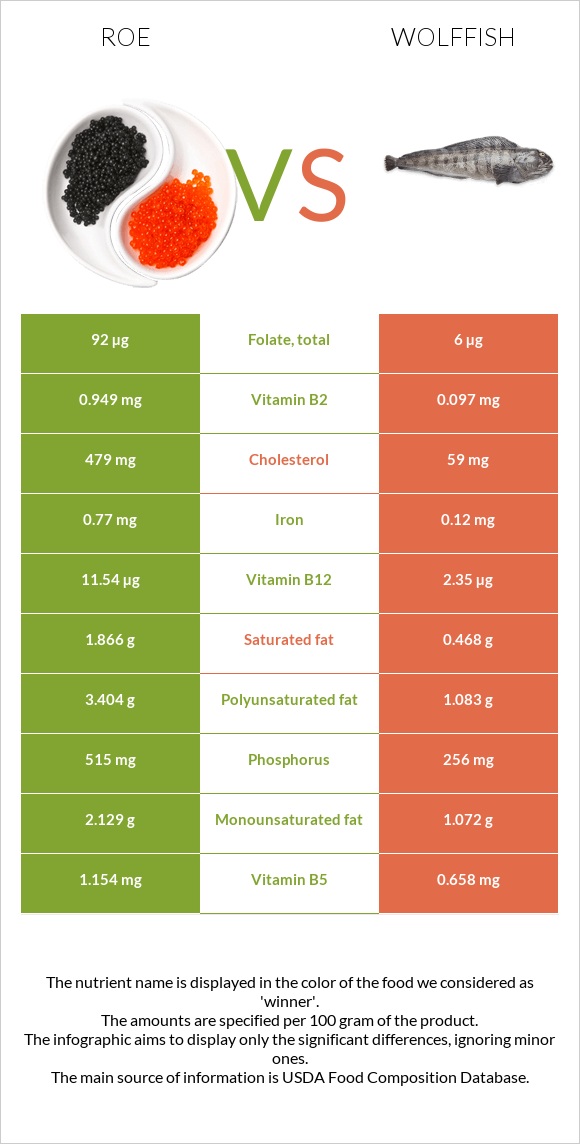
Differences between roe and wolffish Roe has more vitamin B12, vitamin B2, phosphorus, folate, vitamin C, copper, vitamin B5, and selenium, while wolffish has more vitamin B6. Roe's daily need coverage for vitamin B12 is 383% higher. The amount of cholesterol in wolffish is lower. Wolffish has a lower glycemic index. The glycemic index of wolffish is 0, while the glycemic index of roe is 27. The food types used in this comparison are Fish, roe, mixed species, cooked, dry heat and Fish, wolffish, Atlantic, cooked, dry heat .
Infographic
Mineral Comparison
Mineral comparison score is based on the number of minerals by which one or the other food is richer. The "coverage" charts below show how much of the daily needs can be covered by 300 grams of the food.
5
100 g
300 g
1 oz - 28.35g 3 oz - 85g
Magnesium
Magnesium
Calcium
Calcium
Potassium
Potassium
Iron
Iron
Copper
Copper
Zinc
Zinc
Phosphorus
Phosphorus
Sodium
Sodium
Manganese
Manganese
Selenium
Selenium
19%
8.4%
25%
29%
43%
35%
221%
15%
1.7%
282%
3
100 g
300 g
3 oz - 85g 0.5 fillet - 119g
Magnesium
Magnesium
Calcium
Calcium
Potassium
Potassium
Iron
Iron
Copper
Copper
Zinc
Zinc
Phosphorus
Phosphorus
Sodium
Sodium
Manganese
Manganese
Selenium
Selenium
27%
2.4%
34%
4.5%
12%
27%
110%
14%
2.5%
255%
Vitamin Comparison
Vitamin comparison score is based on the number of vitamins by which one or the other food is richer. The "coverage" charts below show how much of the daily needs can be covered by 300 grams of the food.
6
100 g
300 g
1 oz - 28.35g 3 oz - 85g
Vitamin C
Vit. C
Vitamin D
Vit. D
Vitamin A
Vit. A
Vitamin E
Vit. E
Vitamin B1
Vit. B1
Vitamin B2
Vit. B2
Vitamin B3
Vit. B3
Vitamin B5
Vit. B5
Vitamin B6
Vit. B6
Vitamin B12
Vit. B12
Vitamin K
Vit. K
Folate
Folate
55%
0%
30%
0%
69%
219%
41%
69%
43%
1443%
0%
69%
3
100 g
300 g
3 oz - 85g 0.5 fillet - 119g
Vitamin C
Vit. C
Vitamin D
Vit. D
Vitamin A
Vit. A
Vitamin E
Vit. E
Vitamin B1
Vit. B1
Vitamin B2
Vit. B2
Vitamin B3
Vit. B3
Vitamin B5
Vit. B5
Vitamin B6
Vit. B6
Vitamin B12
Vit. B12
Vitamin K
Vit. K
Folate
Folate
0%
0%
43%
0%
52%
22%
49%
39%
107%
294%
0%
4.5%
All nutrients comparison - raw data values
Nutrient
DV% diff.
Vitamin B12
11.54µg
2.35µg
383%
Cholesterol
479mg
59mg
140%
Vitamin B2
0.949mg
0.097mg
66%
Phosphorus
515mg
256mg
37%
Folate
92µg
6µg
22%
Vitamin B6
0.185mg
0.462mg
21%
Vitamin C
16.4mg
0mg
18%
Polyunsaturated fat
3.404g
1.083g
15%
Protein
28.62g
22.44g
12%
Copper
0.128mg
0.037mg
10%
Vitamin B5
1.154mg
0.658mg
10%
Selenium
51.7µg
46.8µg
9%
Fats
8.23g
3.06g
8%
Iron
0.77mg
0.12mg
8%
Vitamin B1
0.277mg
0.208mg
6%
Saturated fat
1.866g
0.468g
6%
Calories
204kcal
123kcal
4%
Vitamin A
91µg
130µg
4%
Magnesium
26mg
38mg
3%
Potassium
283mg
385mg
3%
Zinc
1.28mg
1mg
3%
Vitamin B3
2.192mg
2.598mg
3%
Monounsaturated fat
2.129g
1.072g
3%
Calcium
28mg
8mg
2%
Carbs
1.92g
0g
1%
Protein per 100 calories
14g
18g
N/A
Calories per 10 g protein
71kcal
55kcal
N/A
Weight per 100 calories
49g
81g
N/A
Unsaturated / Saturated Fat ratio
3
4.6
N/A
Net carbs
1.92g
0g
N/A
Sodium
117mg
109mg
0%
Manganese
0.013mg
0.019mg
0%
Tryptophan
0.375mg
0.251mg
0%
Threonine
1.305mg
0.984mg
0%
Isoleucine
1.465mg
1.034mg
0%
Leucine
2.509mg
1.824mg
0%
Lysine
2.179mg
2.061mg
0%
Methionine
0.71mg
0.664mg
0%
Phenylalanine
1.401mg
0.876mg
0%
Valine
1.676mg
1.156mg
0%
Histidine
0.778mg
0.661mg
0%
Omega-3 - EPA
1.26g
0.393g
N/A
Omega-3 - DHA
1.747g
0.405g
N/A
Omega-3 - DPA
0.105g
0.055g
N/A
Macronutrient Comparison
Macronutrient breakdown side-by-side comparison
4
29%
8%
2%
59%
3%
Protein:
28.62 g
Fats:
8.23 g
Carbs:
1.92 g
Water:
58.63 g
Other:
2.6 g
1
22%
3%
74%
Protein:
22.44 g
Fats:
3.06 g
Carbs:
0 g
Water:
74.23 g
Other:
0.27 g
Contains
more
Protein Protein
+27.5%
Contains
more
Fats Fats
+169%
Contains
more
Carbs Carbs
+∞%
Contains
more
Other Other
+863%
Contains
more
Water Water
+26.6%
Fat Type Comparison
Fat type breakdown side-by-side comparison
2
25%
29%
46%
Saturated fat:
Sat. Fat
1.866 g
Monounsaturated fat:
Mono. Fat
2.129 g
Polyunsaturated fat:
Poly. Fat
3.404 g
1
18%
41%
41%
Saturated fat:
Sat. Fat
0.468 g
Monounsaturated fat:
Mono. Fat
1.072 g
Polyunsaturated fat:
Poly. Fat
1.083 g
Contains
more
Mono. Fat Monounsaturated fat
+98.6%
Contains
more
Poly. Fat Polyunsaturated fat
+214.3%
Contains
less
Sat. Fat Saturated fat
-74.9%