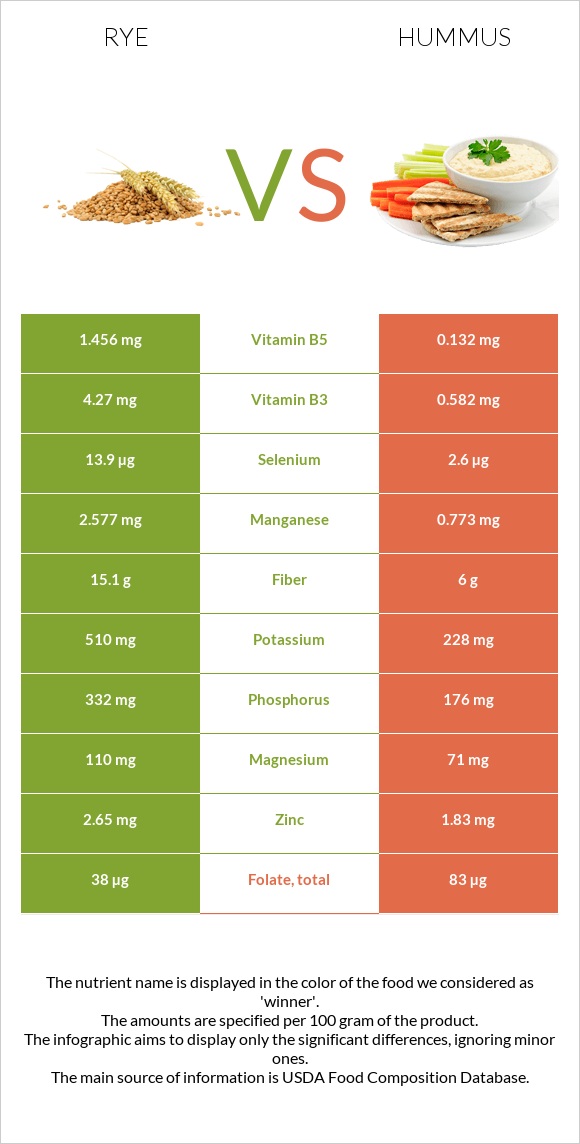
Significant differences between rye and hummus Rye has more manganese, fiber, vitamin B5, vitamin B3, phosphorus, selenium, vitamin B2, and vitamin B1; however, hummus is richer in copper. Rye covers your daily manganese needs 78% more than hummus. Hummus has 11 times less vitamin B5 than rye. Rye has 1.456mg of vitamin B5, while hummus has 0.132mg. Rye contains less sodium. Rye has a higher glycemic index. The glycemic index of rye is 34, while the glycemic index of hummus is 6. Specific food types used in this comparison are Rye grain and Hummus, commercial .
Infographic
Mineral Comparison
Mineral comparison score is based on the number of minerals by which one or the other food is richer. The "coverage" charts below show how much of the daily needs can be covered by 300 grams of the food.
7
100 g
300 g
1 cup - 169g
Magnesium
Magnesium
Calcium
Calcium
Potassium
Potassium
Iron
Iron
Copper
Copper
Zinc
Zinc
Phosphorus
Phosphorus
Sodium
Sodium
Manganese
Manganese
Selenium
Selenium
79%
7.2%
45%
99%
122%
72%
142%
0.26%
336%
76%
2
100 g
300 g
1 tbsp - 15g 1 cup - 246g
Magnesium
Magnesium
Calcium
Calcium
Potassium
Potassium
Iron
Iron
Copper
Copper
Zinc
Zinc
Phosphorus
Phosphorus
Sodium
Sodium
Manganese
Manganese
Selenium
Selenium
51%
11%
20%
92%
176%
50%
75%
49%
101%
14%
Vitamin Comparison
Vitamin comparison score is based on the number of vitamins by which one or the other food is richer. The "coverage" charts below show how much of the daily needs can be covered by 300 grams of the food.
8
100 g
300 g
1 cup - 169g
Vitamin C
Vit. C
Vitamin D
Vit. D
Vitamin A
Vit. A
Vitamin E
Vit. E
Vitamin B1
Vit. B1
Vitamin B2
Vit. B2
Vitamin B3
Vit. B3
Vitamin B5
Vit. B5
Vitamin B6
Vit. B6
Vitamin B12
Vit. B12
Vitamin K
Vit. K
Folate
Folate
0%
0%
0.33%
17%
79%
58%
80%
87%
68%
0%
15%
29%
1
100 g
300 g
1 tbsp - 15g 1 cup - 246g
Vitamin C
Vit. C
Vitamin D
Vit. D
Vitamin A
Vit. A
Vitamin E
Vit. E
Vitamin B1
Vit. B1
Vitamin B2
Vit. B2
Vitamin B3
Vit. B3
Vitamin B5
Vit. B5
Vitamin B6
Vit. B6
Vitamin B12
Vit. B12
Vitamin K
Vit. K
Folate
Folate
0%
0%
0%
0%
45%
15%
11%
7.9%
46%
0%
0%
62%
All nutrients comparison - raw data values
Nutrient
DV% diff.
Manganese
2.577mg
0.773mg
78%
Fiber
15.1g
6g
36%
Vitamin B5
1.456mg
0.132mg
26%
Vitamin B3
4.27mg
0.582mg
23%
Phosphorus
332mg
176mg
22%
Carbs
75.86g
14.29g
21%
Selenium
13.9µg
2.6µg
21%
Polyunsaturated fat
0.767g
3.613g
19%
Copper
0.367mg
0.527mg
18%
Sodium
2mg
379mg
16%
Vitamin B2
0.251mg
0.064mg
14%
Fats
1.63g
9.6g
12%
Vitamin B1
0.316mg
0.18mg
11%
Folate
38µg
83µg
11%
Monounsaturated fat
0.208g
4.039g
10%
Calories
338kcal
166kcal
9%
Magnesium
110mg
71mg
9%
Potassium
510mg
228mg
8%
Zinc
2.65mg
1.83mg
7%
Vitamin B6
0.294mg
0.2mg
7%
Vitamin E
0.85mg
6%
Choline
30.4mg
6%
Saturated fat
0.197g
1.437g
6%
Protein
10.34g
7.9g
5%
Vitamin K
5.9µg
5%
Iron
2.63mg
2.44mg
2%
Calcium
24mg
38mg
1%
Protein per 100 calories
3.1g
4.8g
N/A
Calories per 10 g protein
327kcal
210kcal
N/A
Weight per 100 calories
30g
60g
N/A
Unsaturated / Saturated Fat ratio
4.9
5.3
N/A
Net carbs
60.76g
8.29g
N/A
Sugar
0.98g
N/A
Vitamin A
1µg
0%
Tryptophan
0.108mg
0%
Threonine
0.289mg
0%
Isoleucine
0.208mg
0%
Leucine
0.563mg
0%
Lysine
0.286mg
0%
Methionine
0.153mg
0%
Phenylalanine
0.435mg
0%
Valine
0.317mg
0%
Histidine
0.189mg
0%
Fructose
0.11g
0%
Macronutrient Comparison
Macronutrient breakdown side-by-side comparison
2
10%
76%
11%
Protein:
10.34 g
Fats:
1.63 g
Carbs:
75.86 g
Water:
10.6 g
Other:
1.57 g
3
8%
10%
14%
67%
Protein:
7.9 g
Fats:
9.6 g
Carbs:
14.29 g
Water:
66.59 g
Other:
1.62 g
Contains
more
Protein Protein
+30.9%
Contains
more
Carbs Carbs
+430.9%
Contains
more
Fats Fats
+489%
Contains
more
Water Water
+528.2%
Fat Type Comparison
Fat type breakdown side-by-side comparison
1
17%
18%
65%
Saturated fat:
Sat. Fat
0.197 g
Monounsaturated fat:
Mono. Fat
0.208 g
Polyunsaturated fat:
Poly. Fat
0.767 g
2
16%
44%
40%
Saturated fat:
Sat. Fat
1.437 g
Monounsaturated fat:
Mono. Fat
4.039 g
Polyunsaturated fat:
Poly. Fat
3.613 g
Contains
less
Sat. Fat Saturated fat
-86.3%
Contains
more
Mono. Fat Monounsaturated fat
+1841.8%
Contains
more
Poly. Fat Polyunsaturated fat
+371.1%