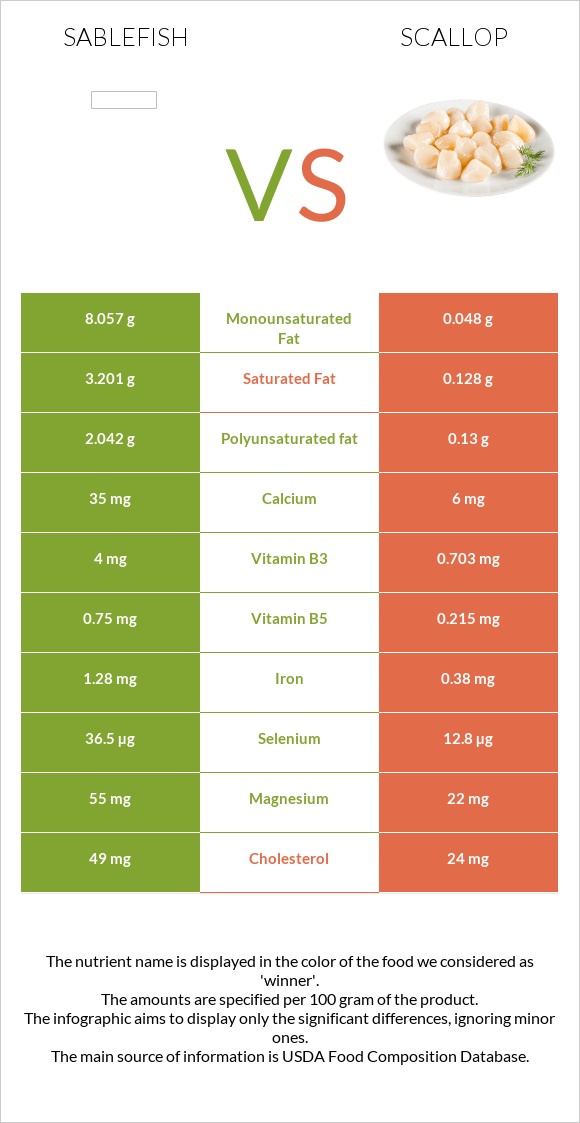
How are sablefish and scallops different? Sablefish is richer in selenium, vitamin B3, vitamin B6, iron, and vitamin B5, while scallops are higher in phosphorus, vitamin B12, and zinc. Sablefish covers your daily need for selenium, 46% more than scallops. Sablefish contains 19 times more saturated fat than scallops. Sablefish contains 4.099g of saturated fat, while scallops contain 0.218g. Fish, sablefish, cooked, dry heat and Mollusks, scallop, (bay and sea), cooked, steamed types were used in this article.
Infographic
Mineral Comparison
Mineral comparison score is based on the number of minerals by which one or the other food is richer. The "coverage" charts below show how much of the daily needs can be covered by 300 grams of the food.
6
100 g
300 g
3 oz - 85g 0.5 fillet - 151g
Magnesium
Magnesium
Calcium
Calcium
Potassium
Potassium
Iron
Iron
Copper
Copper
Zinc
Zinc
Phosphorus
Phosphorus
Sodium
Sodium
Manganese
Manganese
Selenium
Selenium
51%
14%
41%
62%
9.3%
11%
92%
9.4%
2.5%
255%
4
100 g
300 g
3 oz - 85g
Magnesium
Magnesium
Calcium
Calcium
Potassium
Potassium
Iron
Iron
Copper
Copper
Zinc
Zinc
Phosphorus
Phosphorus
Sodium
Sodium
Manganese
Manganese
Selenium
Selenium
26%
3%
28%
22%
11%
42%
183%
87%
3.8%
118%
Vitamin Comparison
Vitamin comparison score is based on the number of vitamins by which one or the other food is richer. The "coverage" charts below show how much of the daily needs can be covered by 300 grams of the food.
6
100 g
300 g
3 oz - 85g 0.5 fillet - 151g
Vitamin C
Vit. C
Vitamin D
Vit. D
Vitamin A
Vit. A
Vitamin E
Vit. E
Vitamin B1
Vit. B1
Vitamin B2
Vit. B2
Vitamin B3
Vit. B3
Vitamin B5
Vit. B5
Vitamin B6
Vit. B6
Vitamin B12
Vit. B12
Vitamin K
Vit. K
Folate
Folate
0%
0%
34%
0%
31%
27%
96%
52%
80%
180%
0%
13%
2
100 g
300 g
3 oz - 85g
Vitamin C
Vit. C
Vitamin D
Vit. D
Vitamin A
Vit. A
Vitamin E
Vit. E
Vitamin B1
Vit. B1
Vitamin B2
Vit. B2
Vitamin B3
Vit. B3
Vitamin B5
Vit. B5
Vitamin B6
Vit. B6
Vitamin B12
Vit. B12
Vitamin K
Vit. K
Folate
Folate
0%
0%
0.67%
0%
3%
5.5%
20%
22%
26%
269%
0%
15%
All nutrients comparison - raw data values
Nutrient
DV% diff.
Selenium
46.8µg
21.7µg
46%
Phosphorus
215mg
426mg
30%
Vitamin B12
1.44µg
2.15µg
30%
Fats
19.62g
0.84g
29%
Sodium
72mg
667mg
26%
Monounsaturated fat
10.328g
0.082g
26%
Vitamin B3
5.128mg
1.076mg
25%
Choline
110.7mg
20%
Vitamin B6
0.346mg
0.112mg
18%
Saturated fat
4.099g
0.218g
18%
Polyunsaturated fat
2.618g
0.222g
16%
Iron
1.64mg
0.58mg
13%
Vitamin A
102µg
2µg
11%
Zinc
0.41mg
1.55mg
10%
Vitamin B5
0.865mg
0.366mg
10%
Vitamin B1
0.122mg
0.012mg
9%
Magnesium
71mg
37mg
8%
Calories
250kcal
111kcal
7%
Protein
17.19g
20.54g
7%
Cholesterol
63mg
41mg
7%
Vitamin B2
0.115mg
0.024mg
7%
Calcium
45mg
10mg
4%
Potassium
459mg
314mg
4%
Carbs
0g
5.41g
2%
Starch
3.69g
2%
Copper
0.028mg
0.033mg
1%
Folate
17µg
20µg
1%
Protein per 100 calories
6.9g
19g
N/A
Calories per 10 g protein
145kcal
54kcal
N/A
Weight per 100 calories
40g
90g
N/A
Unsaturated / Saturated Fat ratio
3.2
1.4
N/A
Net carbs
0g
5.41g
N/A
Vitamin D*
2 IU
0%
Manganese
0.019mg
0.029mg
0%
Trans fat
0.009g
N/A
Tryptophan
0.193mg
0.173mg
0%
Threonine
0.754mg
0.629mg
0%
Isoleucine
0.792mg
0.692mg
0%
Leucine
1.397mg
1.226mg
0%
Lysine
1.579mg
1.258mg
0%
Methionine
0.509mg
0.487mg
0%
Phenylalanine
0.671mg
0.597mg
0%
Valine
0.886mg
0.645mg
0%
Histidine
0.506mg
0.314mg
0%
Omega-3 - EPA
0.867g
0.072g
N/A
Omega-3 - DHA
0.92g
0.104g
N/A
Omega-3 - DPA
0.216g
0.005g
N/A
Omega-6 - Eicosadienoic acid
0.002g
N/A
Macronutrient Comparison
Macronutrient breakdown side-by-side comparison
1
17%
20%
63%
Protein:
17.19 g
Fats:
19.62 g
Carbs:
0 g
Water:
62.85 g
Other:
0.34 g
4
21%
5%
70%
3%
Protein:
20.54 g
Fats:
0.84 g
Carbs:
5.41 g
Water:
70.25 g
Other:
2.96 g
Contains
more
Fats Fats
+2235.7%
Contains
more
Protein Protein
+19.5%
Contains
more
Carbs Carbs
+∞%
Contains
more
Water Water
+11.8%
Contains
more
Other Other
+770.6%
Fat Type Comparison
Fat type breakdown side-by-side comparison
2
24%
61%
15%
Saturated fat:
Sat. Fat
4.099 g
Monounsaturated fat:
Mono. Fat
10.328 g
Polyunsaturated fat:
Poly. Fat
2.618 g
1
42%
16%
43%
Saturated fat:
Sat. Fat
0.218 g
Monounsaturated fat:
Mono. Fat
0.082 g
Polyunsaturated fat:
Poly. Fat
0.222 g
Contains
more
Mono. Fat Monounsaturated fat
+12495.1%
Contains
more
Poly. Fat Polyunsaturated fat
+1079.3%
Contains
less
Sat. Fat Saturated fat
-94.7%