Sesame chicken vs. General tso's chicken — In-Depth Nutrition Comparison
Compare
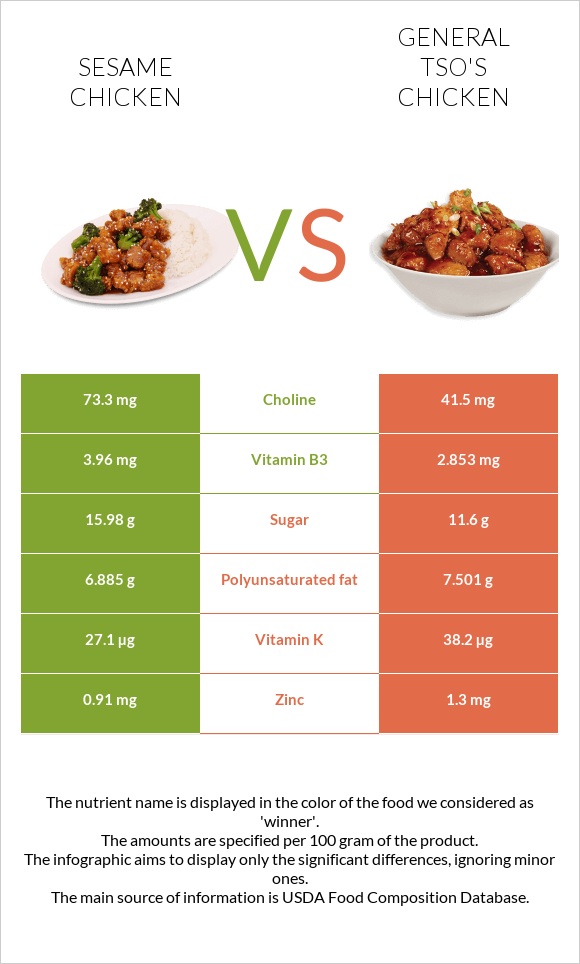
Differences between sesame chicken and general tso's chicken
- Sesame chicken has more vitamin B2, vitamin B3, and choline, while general tso's chicken has more vitamin K and polyunsaturated fat.
- General tso's chicken contains 2 times less vitamin B2 than sesame chicken. Sesame chicken contains 0.225mg of vitamin B2, while general tso's chicken contains 0.118mg.
- The amount of sugar in general tso's chicken is lower.
The food types used in this comparison are Restaurant, Chinese, sesame chicken and Restaurant, Chinese, general tso's chicken.
Infographic
Infographic link
Mineral Comparison
Mineral comparison score is based on the number of minerals by which one or the other food is richer. The "coverage" charts below show how much of the daily needs can be covered by 300 grams of the food.
| Contains more MagnesiumMagnesium | +22.2% |
| Contains more SeleniumSelenium | +16% |
| Contains more ZincZinc | +42.9% |
Vitamin Comparison
Vitamin comparison score is based on the number of vitamins by which one or the other food is richer. The "coverage" charts below show how much of the daily needs can be covered by 300 grams of the food.
| Contains more Vitamin AVitamin A | +654.5% |
| Contains more Vitamin B1Vitamin B1 | +48.1% |
| Contains more Vitamin B2Vitamin B2 | +90.7% |
| Contains more Vitamin B3Vitamin B3 | +38.8% |
| Contains more Vitamin B6Vitamin B6 | +32.2% |
| Contains more Vitamin B12Vitamin B12 | +13.6% |
| Contains more Vitamin CVitamin C | +60% |
| Contains more Vitamin DVitamin D | +100% |
| Contains more Vitamin KVitamin K | +41% |
| Contains more FolateFolate | +37.5% |
All nutrients comparison - raw data values
| Nutrient |  |
 |
DV% diff. |
| Vitamin B5 | 0.617mg | 12% | |
| Vitamin K | 27.1µg | 38.2µg | 9% |
| Vitamin A | 83µg | 11µg | 8% |
| Vitamin B2 | 0.225mg | 0.118mg | 8% |
| Vitamin B3 | 3.96mg | 2.853mg | 7% |
| Choline | 73.3mg | 41.5mg | 6% |
| Vitamin B6 | 0.267mg | 0.202mg | 5% |
| Zinc | 0.91mg | 1.3mg | 4% |
| Selenium | 16.7µg | 14.4µg | 4% |
| Polyunsaturated fat | 6.885g | 7.501g | 4% |
| Protein | 14.33g | 12.9g | 3% |
| Fats | 14.25g | 16.36g | 3% |
| Cholesterol | 59mg | 53mg | 2% |
| Sodium | 482mg | 435mg | 2% |
| Saturated fat | 2.41g | 2.76g | 2% |
| Fructose | 2.01g | 0.51g | 2% |
| Vitamin C | 1mg | 1.6mg | 1% |
| Carbs | 26.88g | 23.99g | 1% |
| Vitamin D | 0.1µg | 0.2µg | 1% |
| Magnesium | 22mg | 18mg | 1% |
| Iron | 1.09mg | 1.16mg | 1% |
| Fiber | 0.7g | 0.9g | 1% |
| Copper | 0.051mg | 0.046mg | 1% |
| Vitamin E | 1.31mg | 1.21mg | 1% |
| Vitamin B1 | 0.04mg | 0.027mg | 1% |
| Vitamin B12 | 0.25µg | 0.22µg | 1% |
| Folate | 8µg | 11µg | 1% |
| Monounsaturated fat | 3.546g | 3.879g | 1% |
| Calories | 293kcal | 295kcal | 0% |
| Protein per 100 calories | 4.9g | 4.4g | N/A |
| Calories per 10 g protein | 204kcal | 229kcal | N/A |
| Weight per 100 calories | 34g | 34g | N/A |
| Unsaturated / Saturated Fat ratio | 4.3 | 4.1 | N/A |
| Net carbs | 26.18g | 23.09g | N/A |
| Vitamin D* | 5 IU | 6 IU | 0% |
| Calcium | 12mg | 12mg | 0% |
| Potassium | 204mg | 201mg | 0% |
| Sugar | 15.98g | 11.6g | N/A |
| Starch | 10.7g | 11.83g | 0% |
| Phosphorus | 130mg | 127mg | 0% |
| Manganese | 0.083mg | 0.075mg | 0% |
| Trans fat | 0.045g | 0.09g | N/A |
| Tryptophan | 0.142mg | 0% | |
| Threonine | 0.552mg | 0% | |
| Isoleucine | 0.564mg | 0% | |
| Leucine | 1.026mg | 0% | |
| Lysine | 1.089mg | 0% | |
| Methionine | 0.332mg | 0% | |
| Phenylalanine | 0.563mg | 0% | |
| Valine | 0.607mg | 0% | |
| Histidine | 0.333mg | 0% | |
| Omega-3 - EPA | 0.003g | 0.005g | N/A |
| Omega-3 - DHA | 0.005g | 0.005g | N/A |
| Omega-3 - ALA | 0.774g | 0.84g | N/A |
| Omega-3 - DPA | 0.006g | 0.006g | N/A |
| Omega-3 - Eicosatrienoic acid | 0.001g | 0.001g | N/A |
| Omega-6 - Gamma-linoleic acid | 0.039g | 0.005g | N/A |
| Omega-6 - Dihomo-gamma-linoleic acid | 0.009g | 0.01g | N/A |
| Omega-6 - Eicosadienoic acid | 0.009g | 0.011g | N/A |
| Omega-6 - Linoleic acid | 5.925g | 6.47g | N/A |
Macronutrient Comparison
Macronutrient breakdown side-by-side comparison
Protein:
14.33 g
Fats:
14.25 g
Carbs:
26.88 g
Water:
42.8 g
Other:
1.74 g
Protein:
12.9 g
Fats:
16.36 g
Carbs:
23.99 g
Water:
45.15 g
Other:
1.6 g
| Contains more CarbsCarbs | +12% |
| Contains more FatsFats | +14.8% |
~equal in
Protein
~12.9g
~equal in
Water
~45.15g
~equal in
Other
~1.6g
Fat Type Comparison
Fat type breakdown side-by-side comparison
Saturated fat:
Sat. Fat
2.41 g
Monounsaturated fat:
Mono. Fat
3.546 g
Polyunsaturated fat:
Poly. Fat
6.885 g
Saturated fat:
Sat. Fat
2.76 g
Monounsaturated fat:
Mono. Fat
3.879 g
Polyunsaturated fat:
Poly. Fat
7.501 g
| Contains less Sat. FatSaturated fat | -12.7% |
~equal in
Monounsaturated fat
~3.879g
~equal in
Polyunsaturated fat
~7.501g
Carbohydrate type comparison
Carbohydrate type breakdown side-by-side comparison
Starch:
10.7 g
Sucrose:
11.79 g
Glucose:
2.18 g
Fructose:
2.01 g
Lactose:
0 g
Maltose:
0 g
Galactose:
0 g
Starch:
11.83 g
Sucrose:
10.46 g
Glucose:
0.62 g
Fructose:
0.51 g
Lactose:
0 g
Maltose:
0 g
Galactose:
0 g
| Contains more SucroseSucrose | +12.7% |
| Contains more GlucoseGlucose | +251.6% |
| Contains more FructoseFructose | +294.1% |
| Contains more StarchStarch | +10.6% |
~equal in
Lactose
~0g
~equal in
Maltose
~0g
~equal in
Galactose
~0g

