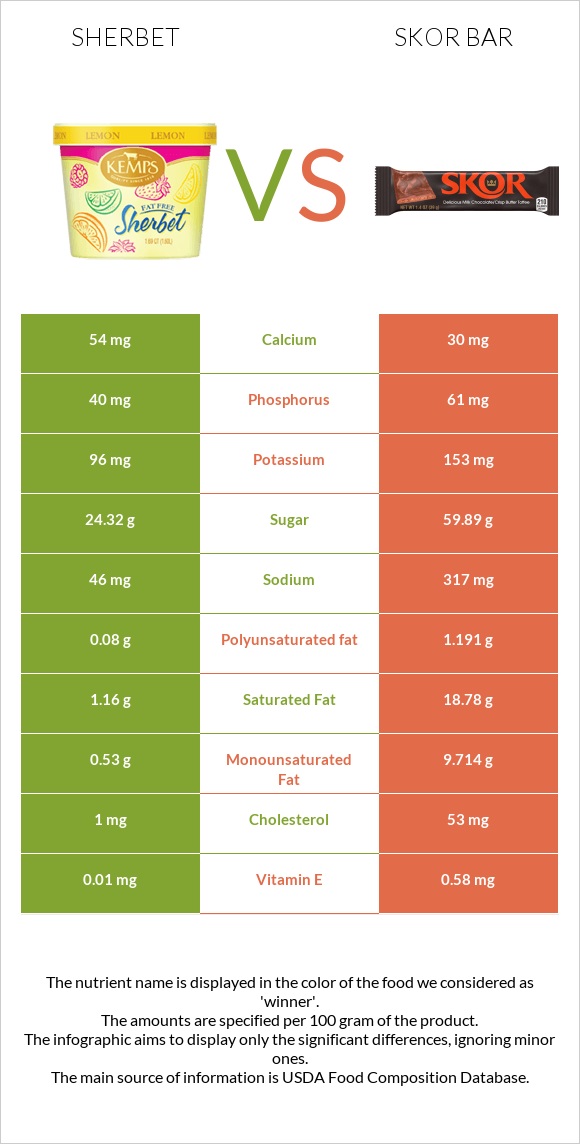
Summary of differences between sherbet and skor bar Sherbet has less vitamin K, iron, and polyunsaturated fat than skor bar. Skor bar covers your daily need for saturated fat, 88% more than sherbet. Sherbet has 2 times more calcium than skor bar. While sherbet has 54mg of calcium, skor bar has only 30mg. Sherbet has less sodium. These are the specific foods used in this comparison Sherbet, orange and Candies, HERSHEY'S SKOR Toffee Bar .
Infographic
Mineral Comparison
Mineral comparison score is based on the number of minerals by which one or the other food is richer. The "coverage" charts below show how much of the daily needs can be covered by 300 grams of the food.
5
100 g
300 g
1 bar (2.75 fl oz) - 66g 0.5 cup (4 fl oz) - 74g
Magnesium
Magnesium
Calcium
Calcium
Potassium
Potassium
Iron
Iron
Copper
Copper
Zinc
Zinc
Phosphorus
Phosphorus
Sodium
Sodium
Manganese
Manganese
Selenium
Selenium
5.7%
16%
8.5%
5.3%
9.3%
13%
17%
6%
1.4%
8.2%
5
100 g
300 g
1 bar 1.4 oz - 39g
Magnesium
Magnesium
Calcium
Calcium
Potassium
Potassium
Iron
Iron
Copper
Copper
Zinc
Zinc
Phosphorus
Phosphorus
Sodium
Sodium
Manganese
Manganese
Selenium
Selenium
7.1%
9%
14%
21%
13%
4.6%
26%
41%
0%
0%
Vitamin Comparison
Vitamin comparison score is based on the number of vitamins by which one or the other food is richer. The "coverage" charts below show how much of the daily needs can be covered by 300 grams of the food.
4
100 g
300 g
1 bar (2.75 fl oz) - 66g 0.5 cup (4 fl oz) - 74g
Vitamin C
Vit. C
Vitamin D
Vit. D
Vitamin A
Vit. A
Vitamin E
Vit. E
Vitamin B1
Vit. B1
Vitamin B2
Vit. B2
Vitamin B3
Vit. B3
Vitamin B5
Vit. B5
Vitamin B6
Vit. B6
Vitamin B12
Vit. B12
Vitamin K
Vit. K
Folate
Folate
7.7%
0%
4%
0.2%
6.8%
22%
1.2%
13%
5.3%
16%
0%
3%
6
100 g
300 g
1 bar 1.4 oz - 39g
Vitamin C
Vit. C
Vitamin D
Vit. D
Vitamin A
Vit. A
Vitamin E
Vit. E
Vitamin B1
Vit. B1
Vitamin B2
Vit. B2
Vitamin B3
Vit. B3
Vitamin B5
Vit. B5
Vitamin B6
Vit. B6
Vitamin B12
Vit. B12
Vitamin K
Vit. K
Folate
Folate
1.7%
1.5%
20%
12%
5%
23%
2.4%
2.4%
5.1%
26%
22%
1.5%
All nutrients comparison - raw data values
Nutrient
DV% diff.
Saturated fat
1.16g
18.78g
80%
Fats
2g
30.37g
44%
Monounsaturated fat
0.53g
9.714g
23%
Calories
144kcal
541kcal
20%
Cholesterol
1mg
53mg
17%
Sodium
46mg
317mg
12%
Carbs
30.4g
63.73g
11%
Vitamin K
0µg
8.6µg
7%
Polyunsaturated fat
0.08g
1.191g
7%
Iron
0.14mg
0.57mg
5%
Vitamin A
12µg
61µg
5%
Protein
1.1g
3.13g
4%
Vitamin E
0.01mg
0.58mg
4%
Vitamin B5
0.224mg
0.04mg
4%
Zinc
0.48mg
0.17mg
3%
Phosphorus
40mg
61mg
3%
Selenium
1.5µg
0µg
3%
Vitamin B12
0.13µg
0.21µg
3%
Caffeine
0mg
10mg
3%
Vitamin C
2.3mg
0.5mg
2%
Calcium
54mg
30mg
2%
Potassium
96mg
153mg
2%
Vitamin D
0µg
0.1µg
1%
Copper
0.028mg
0.04mg
1%
Vitamin B1
0.027mg
0.02mg
1%
Folate
4µg
2µg
1%
Choline
7.7mg
3.1mg
1%
Weight per 100 calories
69g
18g
N/A
Unsaturated / Saturated Fat ratio
0.53
0.58
N/A
Net carbs
29.1g
62.43g
N/A
Vitamin D*
0 IU
3 IU
0%
Magnesium
8mg
10mg
0%
Sugar
24.32g
59.89g
N/A
Fiber
1.3g
1.3g
0%
Manganese
0.011mg
0mg
0%
Vitamin B2
0.097mg
0.1mg
0%
Vitamin B3
0.063mg
0.13mg
0%
Vitamin B6
0.023mg
0.022mg
0%
Macronutrient Comparison
Macronutrient breakdown side-by-side comparison
1
2%
30%
66%
Protein:
1.1 g
Fats:
2 g
Carbs:
30.4 g
Water:
66.1 g
Other:
0.4 g
4
3%
30%
64%
Protein:
3.13 g
Fats:
30.37 g
Carbs:
63.73 g
Water:
1.57 g
Other:
1.2 g
Contains
more
Water Water
+4110.2%
Contains
more
Protein Protein
+184.5%
Contains
more
Fats Fats
+1418.5%
Contains
more
Carbs Carbs
+109.6%
Contains
more
Other Other
+200%
Fat Type Comparison
Fat type breakdown side-by-side comparison
1
66%
30%
5%
Saturated fat:
Sat. Fat
1.16 g
Monounsaturated fat:
Mono. Fat
0.53 g
Polyunsaturated fat:
Poly. Fat
0.08 g
2
63%
33%
4%
Saturated fat:
Sat. Fat
18.78 g
Monounsaturated fat:
Mono. Fat
9.714 g
Polyunsaturated fat:
Poly. Fat
1.191 g
Contains
less
Sat. Fat Saturated fat
-93.8%
Contains
more
Mono. Fat Monounsaturated fat
+1732.8%
Contains
more
Poly. Fat Polyunsaturated fat
+1388.8%