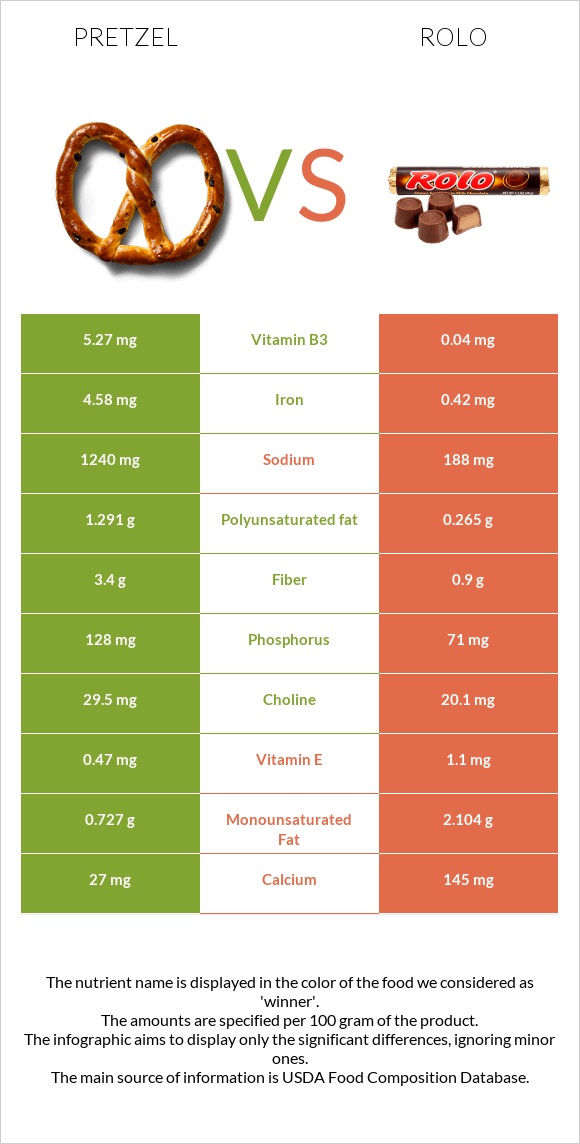
How are pretzel and rolo different? Pretzel is higher in iron, manganese, folate, vitamin B1, vitamin B3, copper, and vitamin B2; however, rolo is richer in vitamin B12. Daily need coverage for saturated fat for rolo is 71% higher. Rolo has less sodium. Snacks, pretzels, hard, plain, salted and Candies, ROLO Caramels in Milk Chocolate are the varieties used in this article.
Infographic
Mineral Comparison
Mineral comparison score is based on the number of minerals by which one or the other food is richer. The "coverage" charts below show how much of the daily needs can be covered by 300 grams of the food.
8
100 g
300 g
1 oz - 28.35g 10 twists - 60g
Magnesium
Magnesium
Calcium
Calcium
Potassium
Potassium
Iron
Iron
Copper
Copper
Zinc
Zinc
Phosphorus
Phosphorus
Sodium
Sodium
Manganese
Manganese
Selenium
Selenium
21%
8.1%
20%
172%
52%
28%
55%
162%
132%
24%
2
100 g
300 g
7 pieces - 42g 1 package 1 package - 48g
Magnesium
Magnesium
Calcium
Calcium
Potassium
Potassium
Iron
Iron
Copper
Copper
Zinc
Zinc
Phosphorus
Phosphorus
Sodium
Sodium
Manganese
Manganese
Selenium
Selenium
0%
44%
17%
16%
0%
0%
30%
25%
0%
0%
Vitamin Comparison
Vitamin comparison score is based on the number of vitamins by which one or the other food is richer. The "coverage" charts below show how much of the daily needs can be covered by 300 grams of the food.
7
100 g
300 g
1 oz - 28.35g 10 twists - 60g
Vitamin C
Vit. C
Vitamin D
Vit. D
Vitamin A
Vit. A
Vitamin E
Vit. E
Vitamin B1
Vit. B1
Vitamin B2
Vit. B2
Vitamin B3
Vit. B3
Vitamin B5
Vit. B5
Vitamin B6
Vit. B6
Vitamin B12
Vit. B12
Vitamin K
Vit. K
Folate
Folate
7%
0%
0%
9.4%
106%
77%
99%
19%
17%
0%
7%
125%
4
100 g
300 g
7 pieces - 42g 1 package 1 package - 48g
Vitamin C
Vit. C
Vitamin D
Vit. D
Vitamin A
Vit. A
Vitamin E
Vit. E
Vitamin B1
Vit. B1
Vitamin B2
Vit. B2
Vitamin B3
Vit. B3
Vitamin B5
Vit. B5
Vitamin B6
Vit. B6
Vitamin B12
Vit. B12
Vitamin K
Vit. K
Folate
Folate
3%
0%
11%
22%
5%
28%
0.75%
0%
0%
41%
8%
0%
All nutrients comparison - raw data values
Nutrient
DV% diff.
Saturated fat
0.391g
14.542g
64%
Iron
4.58mg
0.42mg
52%
Sodium
1240mg
188mg
46%
Manganese
1.015mg
0mg
44%
Folate
166µg
0µg
42%
Vitamin B1
0.424mg
0.02mg
34%
Vitamin B3
5.27mg
0.04mg
33%
Starch
72.58g
30%
Fats
2.93g
20.93g
28%
Copper
0.156mg
0mg
17%
Vitamin B2
0.332mg
0.12mg
16%
Vitamin B12
0µg
0.33µg
14%
Calcium
27mg
145mg
12%
Protein
10.04g
5.08g
10%
Fiber
3.4g
0.9g
10%
Zinc
1.04mg
0mg
9%
Phosphorus
128mg
71mg
8%
Selenium
4.4µg
0µg
8%
Magnesium
29mg
0mg
7%
Polyunsaturated fat
1.291g
0.265g
7%
Vitamin B5
0.322mg
0mg
6%
Vitamin B6
0.074mg
0mg
6%
Calories
384kcal
474kcal
5%
Carbs
80.39g
67.95g
4%
Cholesterol
0mg
12mg
4%
Vitamin A
0µg
34µg
4%
Vitamin E
0.47mg
1.1mg
4%
Monounsaturated fat
0.727g
2.104g
3%
Choline
29.5mg
20.1mg
2%
Caffeine
0mg
6mg
2%
Vitamin C
2.1mg
0.9mg
1%
Potassium
223mg
188mg
1%
Protein per 100 calories
2.6g
1.1g
N/A
Calories per 10 g protein
382kcal
933kcal
N/A
Weight per 100 calories
26g
21g
N/A
Unsaturated / Saturated Fat ratio
5.2
0.16
N/A
Net carbs
76.99g
67.05g
N/A
Sugar
2.21g
63.93g
N/A
Vitamin K
2.8µg
3.2µg
0%
Trans fat
0.004g
0g
N/A
Tryptophan
0.097mg
0%
Threonine
0.25mg
0%
Isoleucine
0.407mg
0%
Leucine
0.757mg
0%
Lysine
0.257mg
0%
Methionine
0.177mg
0%
Phenylalanine
0.52mg
0%
Valine
0.48mg
0%
Histidine
0.22mg
0%
Fructose
0.31g
0%
Omega-3 - ALA
0.063g
N/A
Omega-6 - Gamma-linoleic acid
0.001g
N/A
Omega-6 - Linoleic acid
1.223g
N/A
Macronutrient Comparison
Macronutrient breakdown side-by-side comparison
3
10%
3%
80%
3%
4%
Protein:
10.04 g
Fats:
2.93 g
Carbs:
80.39 g
Water:
3.13 g
Other:
3.51 g
2
5%
21%
68%
5%
Protein:
5.08 g
Fats:
20.93 g
Carbs:
67.95 g
Water:
4.6 g
Other:
1.44 g
Contains
more
Protein Protein
+97.6%
Contains
more
Carbs Carbs
+18.3%
Contains
more
Other Other
+143.8%
Contains
more
Fats Fats
+614.3%
Contains
more
Water Water
+47%
Fat Type Comparison
Fat type breakdown side-by-side comparison
2
16%
30%
54%
Saturated fat:
Sat. Fat
0.391 g
Monounsaturated fat:
Mono. Fat
0.727 g
Polyunsaturated fat:
Poly. Fat
1.291 g
1
86%
12%
Saturated fat:
Sat. Fat
14.542 g
Monounsaturated fat:
Mono. Fat
2.104 g
Polyunsaturated fat:
Poly. Fat
0.265 g
Contains
less
Sat. Fat Saturated fat
-97.3%
Contains
more
Poly. Fat Polyunsaturated fat
+387.2%
Contains
more
Mono. Fat Monounsaturated fat
+189.4%