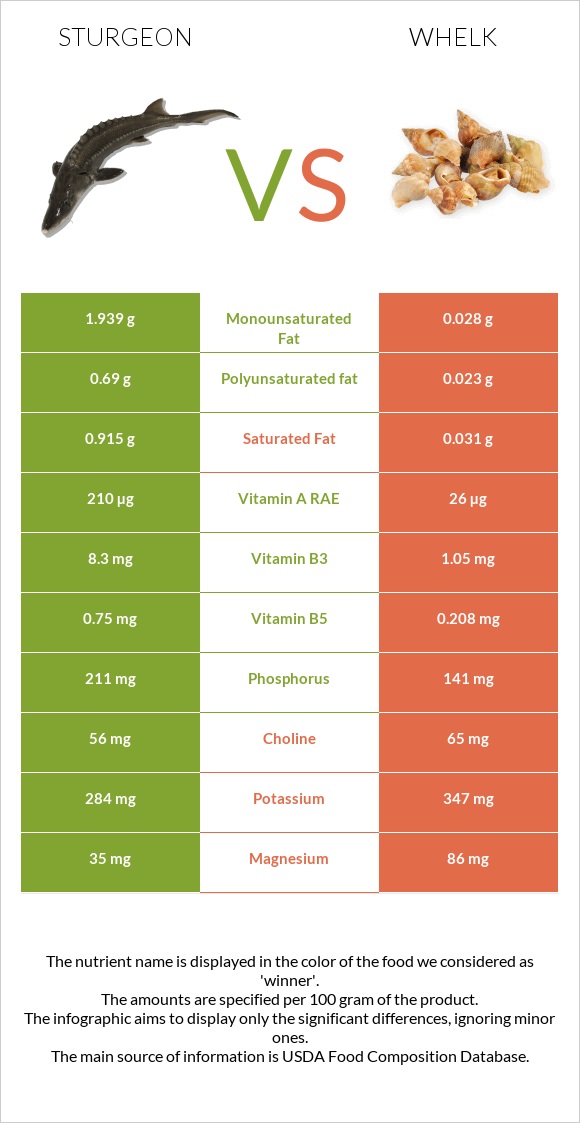
Summary of differences between sturgeon and whelk Sturgeon has more vitamin B3; however, whelk is higher in vitamin B12, copper, selenium, iron, manganese, vitamin B6, magnesium, and zinc. Whelk covers your daily need for vitamin B12, 652% more than sturgeon. Sturgeon has 5 times more vitamin B3 than whelk. While sturgeon has 10.1mg of vitamin B3, whelk has only 1.995mg. Sturgeon has less cholesterol. These are the specific foods used in this comparison Fish, sturgeon, mixed species, cooked, dry heat and Mollusks, whelk, unspecified, cooked, moist heat .
Infographic
Mineral Comparison
Mineral comparison score is based on the number of minerals by which one or the other food is richer. The "coverage" charts below show how much of the daily needs can be covered by 300 grams of the food.
1
100 g
300 g
1 cubic inch, boneless - 17g 1 oz, boneless - 28.35g 3 oz - 85g 1 cup, cooked - 136g 1 piece (4-1/2" x 2-1/8" x 7/8") - 145g
Magnesium
Magnesium
Calcium
Calcium
Potassium
Potassium
Iron
Iron
Copper
Copper
Zinc
Zinc
Phosphorus
Phosphorus
Sodium
Sodium
Manganese
Manganese
Selenium
Selenium
32%
5.1%
32%
34%
18%
15%
116%
9%
3.9%
88%
8
100 g
300 g
3 oz - 85g
Magnesium
Magnesium
Calcium
Calcium
Potassium
Potassium
Iron
Iron
Copper
Copper
Zinc
Zinc
Phosphorus
Phosphorus
Sodium
Sodium
Manganese
Manganese
Selenium
Selenium
123%
34%
61%
377%
687%
89%
121%
54%
116%
489%
Vitamin Comparison
Vitamin comparison score is based on the number of vitamins by which one or the other food is richer. The "coverage" charts below show how much of the daily needs can be covered by 300 grams of the food.
8
100 g
300 g
1 cubic inch, boneless - 17g 1 oz, boneless - 28.35g 3 oz - 85g 1 cup, cooked - 136g 1 piece (4-1/2" x 2-1/8" x 7/8") - 145g
Vitamin C
Vit. C
Vitamin D
Vit. D
Vitamin A
Vit. A
Vitamin E
Vit. E
Vitamin B1
Vit. B1
Vitamin B2
Vit. B2
Vitamin B3
Vit. B3
Vitamin B5
Vit. B5
Vitamin B6
Vit. B6
Vitamin B12
Vit. B12
Vitamin K
Vit. K
Folate
Folate
0%
194%
88%
13%
20%
21%
189%
52%
53%
313%
0.25%
13%
4
100 g
300 g
3 oz - 85g
Vitamin C
Vit. C
Vitamin D
Vit. D
Vitamin A
Vit. A
Vitamin E
Vit. E
Vitamin B1
Vit. B1
Vitamin B2
Vit. B2
Vitamin B3
Vit. B3
Vitamin B5
Vit. B5
Vitamin B6
Vit. B6
Vitamin B12
Vit. B12
Vitamin K
Vit. K
Folate
Folate
23%
0%
16%
0%
12%
49%
37%
24%
150%
2268%
0%
8.3%
All nutrients comparison - raw data values
Nutrient
DV% diff.
Vitamin B12
2.5µg
18.14µg
652%
Copper
0.053mg
2.06mg
223%
Selenium
16.2µg
89.6µg
133%
Iron
0.9mg
10.06mg
115%
Vitamin D
12.9µg
65%
Vitamin D*
515 IU
64%
Protein
20.7g
47.68g
54%
Vitamin B3
10.1mg
1.995mg
51%
Manganese
0.03mg
0.89mg
37%
Vitamin B6
0.23mg
0.65mg
32%
Magnesium
45mg
172mg
30%
Zinc
0.54mg
3.26mg
25%
Vitamin A
263µg
49µg
24%
Cholesterol
77mg
130mg
18%
Sodium
69mg
412mg
15%
Choline
70mg
13%
Calcium
17mg
113mg
10%
Potassium
364mg
694mg
10%
Vitamin B2
0.09mg
0.214mg
10%
Vitamin B5
0.87mg
0.4mg
9%
Vitamin C
0mg
6.8mg
8%
Calories
135kcal
275kcal
7%
Fats
5.18g
0.8g
7%
Monounsaturated fat
2.486g
0.056g
6%
Polyunsaturated fat
0.885g
0.046g
6%
Carbs
0g
15.52g
5%
Saturated fat
1.173g
0.062g
5%
Vitamin E
0.63mg
4%
Vitamin B1
0.08mg
0.049mg
3%
Phosphorus
271mg
282mg
2%
Folate
17µg
11µg
2%
Protein per 100 calories
15g
17g
N/A
Calories per 10 g protein
65kcal
58kcal
N/A
Weight per 100 calories
74g
36g
N/A
Unsaturated / Saturated Fat ratio
2.9
1.6
N/A
Net carbs
0g
15.52g
N/A
Vitamin K
0.1µg
0%
Tryptophan
0.232mg
0.618mg
0%
Threonine
0.907mg
2.136mg
0%
Isoleucine
0.954mg
1.655mg
0%
Leucine
1.682mg
3.807mg
0%
Lysine
1.901mg
2.93mg
0%
Methionine
0.613mg
1.205mg
0%
Phenylalanine
0.808mg
1.648mg
0%
Valine
1.066mg
2.075mg
0%
Histidine
0.609mg
0.977mg
0%
Omega-3 - EPA
0.249g
0.008g
N/A
Omega-3 - DHA
0.119g
0.012g
N/A
Omega-3 - DPA
0.058g
N/A
Macronutrient Comparison
Macronutrient breakdown side-by-side comparison
3
21%
5%
70%
4%
Protein:
20.7 g
Fats:
5.18 g
Carbs:
0 g
Water:
69.94 g
Other:
4.18 g
2
48%
16%
32%
4%
Protein:
47.68 g
Fats:
0.8 g
Carbs:
15.52 g
Water:
32 g
Other:
4 g
Contains
more
Fats Fats
+547.5%
Contains
more
Water Water
+118.6%
Contains
more
Protein Protein
+130.3%
Contains
more
Carbs Carbs
+∞%
Fat Type Comparison
Fat type breakdown side-by-side comparison
2
26%
55%
19%
Saturated fat:
Sat. Fat
1.173 g
Monounsaturated fat:
Mono. Fat
2.486 g
Polyunsaturated fat:
Poly. Fat
0.885 g
1
38%
34%
28%
Saturated fat:
Sat. Fat
0.062 g
Monounsaturated fat:
Mono. Fat
0.056 g
Polyunsaturated fat:
Poly. Fat
0.046 g
Contains
more
Mono. Fat Monounsaturated fat
+4339.3%
Contains
more
Poly. Fat Polyunsaturated fat
+1823.9%
Contains
less
Sat. Fat Saturated fat
-94.7%