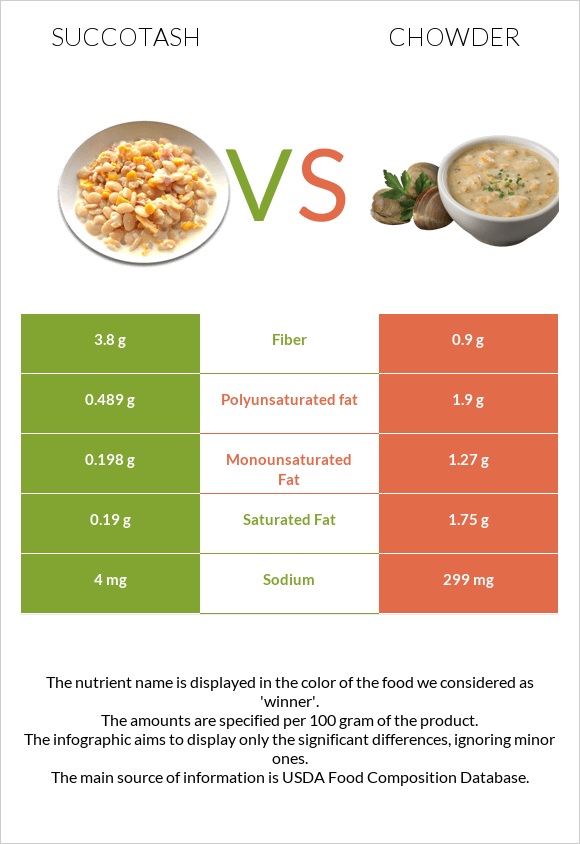
Significant differences between succotash and chowder Succotash has more fiber; however, chowder is richer in vitamin A, monounsaturated fat, and polyunsaturated fat. Chowder covers your daily vitamin A needs 17% more than succotash. Chowder has 4 times less fiber than succotash. Succotash has 3.8g of fiber, while chowder has 0.9g. Succotash contains less saturated fat. Specific food types used in this comparison are Succotash, (corn and limas), raw and Soup, chicken corn chowder, chunky, ready-to-serve, single brand .
Infographic
Mineral Comparison
Mineral comparison score is based on the number of minerals by which one or the other food is richer. The "coverage" charts below show how much of the daily needs can be covered by 300 grams of the food.
10
100 g
300 g
Magnesium
Magnesium
Calcium
Calcium
Potassium
Potassium
Iron
Iron
Copper
Copper
Zinc
Zinc
Phosphorus
Phosphorus
Sodium
Sodium
Manganese
Manganese
Selenium
Selenium
34%
5.4%
33%
69%
62%
17%
48%
0.52%
90%
3.3%
0
100 g
300 g
1 serving - 240g 1 package yields - 539g
Magnesium
Magnesium
Calcium
Calcium
Potassium
Potassium
Iron
Iron
Copper
Copper
Zinc
Zinc
Phosphorus
Phosphorus
Sodium
Sodium
Manganese
Manganese
Selenium
Selenium
0%
0%
0%
0%
0%
0%
0%
39%
0%
0%
Vitamin Comparison
Vitamin comparison score is based on the number of vitamins by which one or the other food is richer. The "coverage" charts below show how much of the daily needs can be covered by 300 grams of the food.
7
100 g
300 g
Vitamin C
Vit. C
Vitamin D
Vit. D
Vitamin A
Vit. A
Vitamin E
Vit. E
Vitamin B1
Vit. B1
Vitamin B2
Vit. B2
Vitamin B3
Vit. B3
Vitamin B5
Vit. B5
Vitamin B6
Vit. B6
Vitamin B12
Vit. B12
Vitamin K
Vit. K
Folate
Folate
50%
0%
5%
0%
52%
19%
30%
7.7%
30%
0%
0%
30%
1
100 g
300 g
1 serving - 240g 1 package yields - 539g
Vitamin C
Vit. C
Vitamin D
Vit. D
Vitamin A
Vit. A
Vitamin E
Vit. E
Vitamin B1
Vit. B1
Vitamin B2
Vit. B2
Vitamin B3
Vit. B3
Vitamin B5
Vit. B5
Vitamin B6
Vit. B6
Vitamin B12
Vit. B12
Vitamin K
Vit. K
Folate
Folate
0%
0%
19%
0%
0%
0%
0%
0%
0%
0%
0%
0%
All nutrients comparison - raw data values
Nutrient
DV% diff.
Manganese
0.688mg
30%
Iron
1.83mg
23%
Copper
0.186mg
21%
Vitamin C
15.1mg
17%
Vitamin B1
0.208mg
17%
Phosphorus
113mg
16%
Sodium
4mg
299mg
13%
Fiber
3.8g
0.9g
12%
Magnesium
48mg
11%
Potassium
369mg
11%
Vitamin B3
1.587mg
10%
Vitamin B6
0.13mg
10%
Folate
40µg
10%
Polyunsaturated fat
0.489g
1.9g
9%
Fats
1.02g
6.3g
8%
Saturated fat
0.19g
1.75g
7%
Zinc
0.61mg
6%
Vitamin B2
0.082mg
6%
Vitamin A
15µg
58µg
5%
Protein
5.03g
3.1g
4%
Carbs
19.59g
7.5g
4%
Cholesterol
0mg
11mg
4%
Vitamin B5
0.128mg
3%
Monounsaturated fat
0.198g
1.27g
3%
Calcium
18mg
2%
Selenium
0.6µg
1%
Calories
99kcal
99kcal
0%
Protein per 100 calories
5.1g
3.1g
N/A
Calories per 10 g protein
197kcal
319kcal
N/A
Weight per 100 calories
101g
101g
N/A
Unsaturated / Saturated Fat ratio
3.6
1.8
N/A
Net carbs
15.79g
6.6g
N/A
Tryptophan
0.056mg
0%
Threonine
0.209mg
0%
Isoleucine
0.284mg
0%
Leucine
0.443mg
0%
Lysine
0.295mg
0%
Methionine
0.068mg
0%
Phenylalanine
0.243mg
0%
Valine
0.306mg
0%
Histidine
0.16mg
0%
Macronutrient Comparison
Macronutrient breakdown side-by-side comparison
3
5%
20%
73%
Protein:
5.03 g
Fats:
1.02 g
Carbs:
19.59 g
Water:
73.1 g
Other:
1.26 g
2
3%
6%
8%
82%
Protein:
3.1 g
Fats:
6.3 g
Carbs:
7.5 g
Water:
82.1 g
Other:
1 g
Contains
more
Protein Protein
+62.3%
Contains
more
Carbs Carbs
+161.2%
Contains
more
Other Other
+26%
Contains
more
Fats Fats
+517.6%
Contains
more
Water Water
+12.3%
Fat Type Comparison
Fat type breakdown side-by-side comparison
1
22%
23%
56%
Saturated fat:
Sat. Fat
0.19 g
Monounsaturated fat:
Mono. Fat
0.198 g
Polyunsaturated fat:
Poly. Fat
0.489 g
2
36%
26%
39%
Saturated fat:
Sat. Fat
1.75 g
Monounsaturated fat:
Mono. Fat
1.27 g
Polyunsaturated fat:
Poly. Fat
1.9 g
Contains
less
Sat. Fat Saturated fat
-89.1%
Contains
more
Mono. Fat Monounsaturated fat
+541.4%
Contains
more
Poly. Fat Polyunsaturated fat
+288.5%