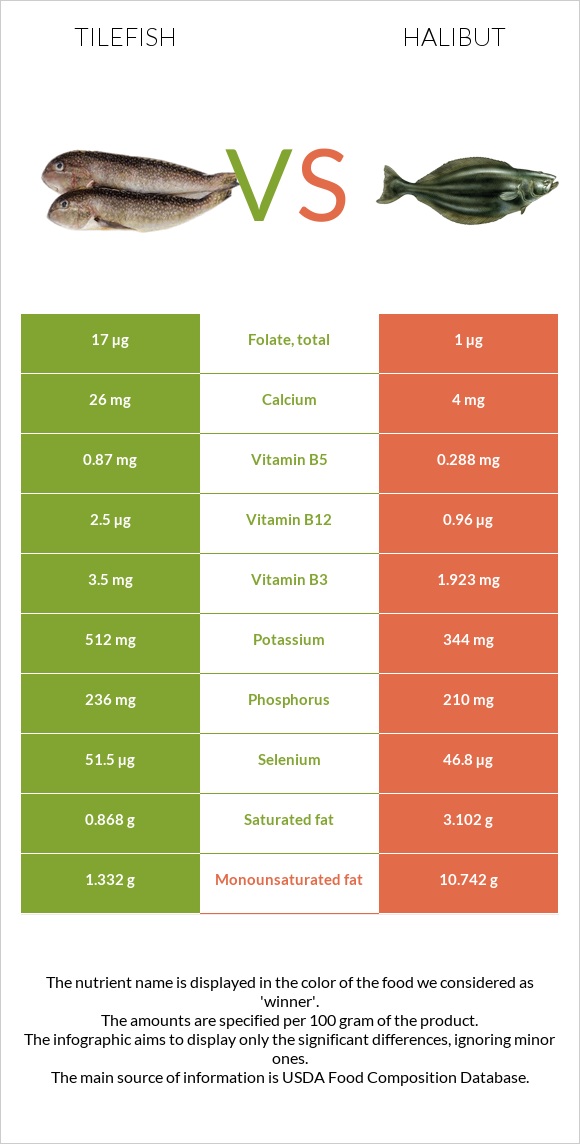
How are tilefish and halibut different? Tilefish is higher in vitamin B12, vitamin B5, vitamin B3, selenium, vitamin B2, and vitamin B1; however, halibut is richer in vitamin B6 and iron. Daily need coverage for vitamin B12 for tilefish is 64% higher. Tilefish contains 3 times more vitamin B5 than halibut. While tilefish contains 0.87mg of vitamin B5, halibut contains only 0.288mg. Tilefish has less saturated fat. Fish, tilefish, cooked, dry heat and Fish, halibut, greenland, cooked, dry heat are the varieties used in this article.
Infographic
Mineral Comparison
Mineral comparison score is based on the number of minerals by which one or the other food is richer. The "coverage" charts below show how much of the daily needs can be covered by 300 grams of the food.
5
100 g
300 g
3 oz - 85g 0.5 fillet - 150g
Magnesium
Magnesium
Calcium
Calcium
Potassium
Potassium
Iron
Iron
Copper
Copper
Zinc
Zinc
Phosphorus
Phosphorus
Sodium
Sodium
Manganese
Manganese
Selenium
Selenium
24%
7.8%
45%
12%
17%
14%
101%
7.7%
2%
281%
1
100 g
300 g
3 oz - 85g 0.5 fillet - 159g
Magnesium
Magnesium
Calcium
Calcium
Potassium
Potassium
Iron
Iron
Copper
Copper
Zinc
Zinc
Phosphorus
Phosphorus
Sodium
Sodium
Manganese
Manganese
Selenium
Selenium
24%
1.2%
30%
32%
13%
14%
90%
13%
2%
255%
Vitamin Comparison
Vitamin comparison score is based on the number of vitamins by which one or the other food is richer. The "coverage" charts below show how much of the daily needs can be covered by 300 grams of the food.
7
100 g
300 g
3 oz - 85g 0.5 fillet - 150g
Vitamin C
Vit. C
Vitamin D
Vit. D
Vitamin A
Vit. A
Vitamin E
Vit. E
Vitamin B1
Vit. B1
Vitamin B2
Vit. B2
Vitamin B3
Vit. B3
Vitamin B5
Vit. B5
Vitamin B6
Vit. B6
Vitamin B12
Vit. B12
Vitamin K
Vit. K
Folate
Folate
0%
0%
7%
0%
35%
44%
66%
52%
69%
313%
0%
13%
1
100 g
300 g
3 oz - 85g 0.5 fillet - 159g
Vitamin C
Vit. C
Vitamin D
Vit. D
Vitamin A
Vit. A
Vitamin E
Vit. E
Vitamin B1
Vit. B1
Vitamin B2
Vit. B2
Vitamin B3
Vit. B3
Vitamin B5
Vit. B5
Vitamin B6
Vit. B6
Vitamin B12
Vit. B12
Vitamin K
Vit. K
Folate
Folate
0%
0%
6%
0%
18%
24%
36%
17%
112%
120%
0%
0.75%
All nutrients comparison - raw data values
Nutrient
DV% diff.
Vitamin B12
2.5µg
0.96µg
64%
Monounsaturated fat
1.332g
10.742g
24%
Fats
4.69g
17.74g
20%
Vitamin B6
0.3mg
0.485mg
14%
Protein
24.49g
18.42g
12%
Vitamin B5
0.87mg
0.288mg
12%
Vitamin B3
3.5mg
1.923mg
10%
Saturated fat
0.868g
3.102g
10%
Selenium
51.5µg
46.8µg
9%
Iron
0.31mg
0.85mg
7%
Vitamin B2
0.19mg
0.103mg
7%
Vitamin B1
0.14mg
0.073mg
6%
Calories
147kcal
239kcal
5%
Potassium
512mg
344mg
5%
Phosphorus
236mg
210mg
4%
Folate
17µg
1µg
4%
Polyunsaturated fat
1.246g
1.753g
3%
Cholesterol
64mg
59mg
2%
Calcium
26mg
4mg
2%
Copper
0.052mg
0.038mg
2%
Sodium
59mg
103mg
2%
Protein per 100 calories
17g
7.7g
N/A
Calories per 10 g protein
60kcal
130kcal
N/A
Weight per 100 calories
68g
42g
N/A
Unsaturated / Saturated Fat ratio
3
4
N/A
Magnesium
33mg
33mg
0%
Zinc
0.53mg
0.51mg
0%
Vitamin A
21µg
18µg
0%
Manganese
0.015mg
0.015mg
0%
Tryptophan
0.274mg
0.206mg
0%
Threonine
1.074mg
0.808mg
0%
Isoleucine
1.128mg
0.849mg
0%
Leucine
1.99mg
1.497mg
0%
Lysine
2.249mg
1.692mg
0%
Methionine
0.725mg
0.545mg
0%
Phenylalanine
0.956mg
0.719mg
0%
Valine
1.262mg
0.949mg
0%
Histidine
0.721mg
0.542mg
0%
Omega-3 - EPA
0.172g
0.674g
N/A
Omega-3 - DHA
0.733g
0.504g
N/A
Omega-3 - DPA
0.143g
0.114g
N/A
Macronutrient Comparison
Macronutrient breakdown side-by-side comparison
2
24%
5%
70%
Protein:
24.49 g
Fats:
4.69 g
Carbs:
0 g
Water:
70.24 g
Other:
0.58 g
2
18%
18%
62%
2%
Protein:
18.42 g
Fats:
17.74 g
Carbs:
0 g
Water:
61.88 g
Other:
1.96 g
Contains
more
Protein Protein
+33%
Contains
more
Water Water
+13.5%
Contains
more
Fats Fats
+278.3%
Contains
more
Other Other
+237.9%
Fat Type Comparison
Fat type breakdown side-by-side comparison
1
25%
39%
36%
Saturated fat:
Sat. Fat
0.868 g
Monounsaturated fat:
Mono. Fat
1.332 g
Polyunsaturated fat:
Poly. Fat
1.246 g
2
20%
69%
11%
Saturated fat:
Sat. Fat
3.102 g
Monounsaturated fat:
Mono. Fat
10.742 g
Polyunsaturated fat:
Poly. Fat
1.753 g
Contains
less
Sat. Fat Saturated fat
-72%
Contains
more
Mono. Fat Monounsaturated fat
+706.5%
Contains
more
Poly. Fat Polyunsaturated fat
+40.7%