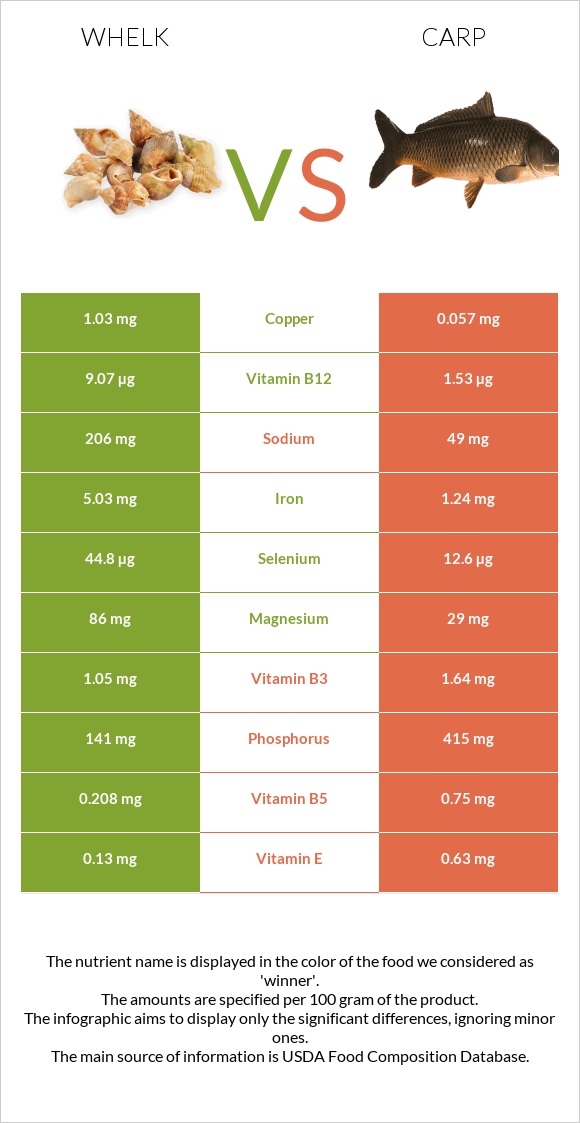
What are the differences between whelk and carp? Whelk is higher in vitamin B12, copper, selenium, iron, manganese, vitamin B6, and magnesium; however, carp is richer in phosphorus. Whelk's daily need coverage for vitamin B12 is 695% more. Carp contains 28 times less copper than whelk. Whelk contains 2.06mg of copper, while carp contains 0.073mg. Carp has less sodium. We used Mollusks, whelk, unspecified, cooked, moist heat and Fish, carp, cooked, dry heat types in this article.
Infographic
Mineral Comparison
Mineral comparison score is based on the number of minerals by which one or the other food is richer. The "coverage" charts below show how much of the daily needs can be covered by 300 grams of the food.
8
100 g
300 g
3 oz - 85g
Magnesium
Magnesium
Calcium
Calcium
Potassium
Potassium
Iron
Iron
Copper
Copper
Zinc
Zinc
Phosphorus
Phosphorus
Sodium
Sodium
Manganese
Manganese
Selenium
Selenium
123%
34%
61%
377%
687%
89%
121%
54%
116%
489%
2
100 g
300 g
3 oz - 85g 1 fillet - 170g
Magnesium
Magnesium
Calcium
Calcium
Potassium
Potassium
Iron
Iron
Copper
Copper
Zinc
Zinc
Phosphorus
Phosphorus
Sodium
Sodium
Manganese
Manganese
Selenium
Selenium
27%
16%
38%
60%
24%
52%
228%
8.2%
6.5%
88%
Vitamin Comparison
Vitamin comparison score is based on the number of vitamins by which one or the other food is richer. The "coverage" charts below show how much of the daily needs can be covered by 300 grams of the food.
5
100 g
300 g
3 oz - 85g
Vitamin C
Vit. C
Vitamin D
Vit. D
Vitamin A
Vit. A
Vitamin E
Vit. E
Vitamin B1
Vit. B1
Vitamin B2
Vit. B2
Vitamin B3
Vit. B3
Vitamin B5
Vit. B5
Vitamin B6
Vit. B6
Vitamin B12
Vit. B12
Vitamin K
Vit. K
Folate
Folate
23%
0%
16%
0%
12%
49%
37%
24%
150%
2268%
0%
8.3%
3
100 g
300 g
3 oz - 85g 1 fillet - 170g
Vitamin C
Vit. C
Vitamin D
Vit. D
Vitamin A
Vit. A
Vitamin E
Vit. E
Vitamin B1
Vit. B1
Vitamin B2
Vit. B2
Vitamin B3
Vit. B3
Vitamin B5
Vit. B5
Vitamin B6
Vit. B6
Vitamin B12
Vit. B12
Vitamin K
Vit. K
Folate
Folate
5.3%
0%
3.3%
0%
35%
16%
39%
52%
51%
184%
0%
13%
All nutrients comparison - raw data values
Nutrient
DV% diff.
Vitamin B12
18.14µg
1.47µg
695%
Copper
2.06mg
0.073mg
221%
Selenium
89.6µg
16.2µg
133%
Iron
10.06mg
1.59mg
106%
Protein
47.68g
22.86g
50%
Manganese
0.89mg
0.05mg
37%
Phosphorus
282mg
531mg
36%
Vitamin B6
0.65mg
0.219mg
33%
Magnesium
172mg
38mg
32%
Cholesterol
130mg
84mg
15%
Sodium
412mg
63mg
15%
Zinc
3.26mg
1.9mg
12%
Polyunsaturated fat
0.046g
1.835g
12%
Vitamin B2
0.214mg
0.07mg
11%
Fats
0.8g
7.17g
10%
Vitamin B5
0.4mg
0.87mg
9%
Potassium
694mg
427mg
8%
Vitamin B1
0.049mg
0.14mg
8%
Monounsaturated fat
0.056g
2.985g
7%
Calories
275kcal
162kcal
6%
Vitamin C
6.8mg
1.6mg
6%
Calcium
113mg
52mg
6%
Saturated fat
0.062g
1.388g
6%
Carbs
15.52g
0g
5%
Vitamin A
49µg
10µg
4%
Folate
11µg
17µg
2%
Vitamin B3
1.995mg
2.1mg
1%
Protein per 100 calories
17g
14g
N/A
Calories per 10 g protein
58kcal
71kcal
N/A
Weight per 100 calories
36g
62g
N/A
Unsaturated / Saturated Fat ratio
1.6
3.5
N/A
Net carbs
15.52g
0g
N/A
Tryptophan
0.618mg
0.256mg
0%
Threonine
2.136mg
1.002mg
0%
Isoleucine
1.655mg
1.054mg
0%
Leucine
3.807mg
1.858mg
0%
Lysine
2.93mg
2.1mg
0%
Methionine
1.205mg
0.677mg
0%
Phenylalanine
1.648mg
0.893mg
0%
Valine
2.075mg
1.178mg
0%
Histidine
0.977mg
0.673mg
0%
Omega-3 - EPA
0.008g
0.305g
N/A
Omega-3 - DHA
0.012g
0.146g
N/A
Omega-3 - DPA
0.105g
N/A
Macronutrient Comparison
Macronutrient breakdown side-by-side comparison
3
48%
16%
32%
4%
Protein:
47.68 g
Fats:
0.8 g
Carbs:
15.52 g
Water:
32 g
Other:
4 g
2
23%
7%
70%
Protein:
22.86 g
Fats:
7.17 g
Carbs:
0 g
Water:
69.63 g
Other:
0.34 g
Contains
more
Protein Protein
+108.6%
Contains
more
Carbs Carbs
+∞%
Contains
more
Other Other
+1076.5%
Contains
more
Fats Fats
+796.3%
Contains
more
Water Water
+117.6%
Fat Type Comparison
Fat type breakdown side-by-side comparison
1
38%
34%
28%
Saturated fat:
Sat. Fat
0.062 g
Monounsaturated fat:
Mono. Fat
0.056 g
Polyunsaturated fat:
Poly. Fat
0.046 g
2
22%
48%
30%
Saturated fat:
Sat. Fat
1.388 g
Monounsaturated fat:
Mono. Fat
2.985 g
Polyunsaturated fat:
Poly. Fat
1.835 g
Contains
less
Sat. Fat Saturated fat
-95.5%
Contains
more
Mono. Fat Monounsaturated fat
+5230.4%
Contains
more
Poly. Fat Polyunsaturated fat
+3889.1%