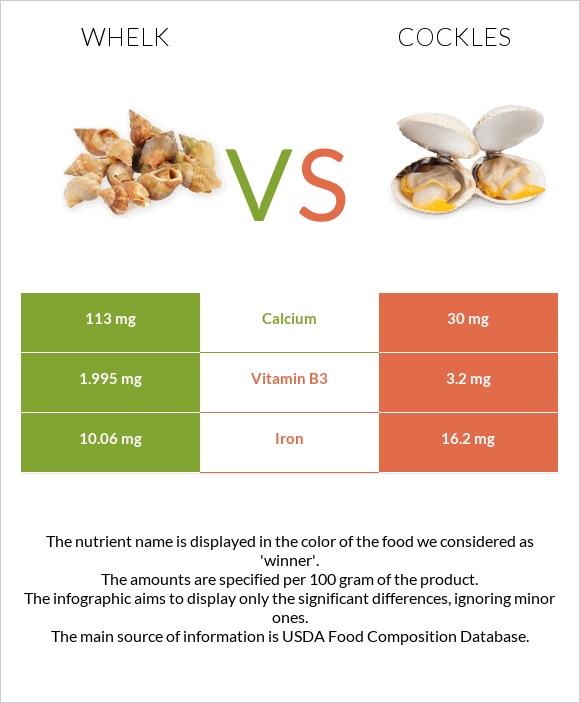
What are the main differences between whelk and cockles? Whelk is richer in calcium, while cockles are higher in iron and vitamin B3. Cockles' daily need coverage for iron is 77% higher. Cockles have 4 times less calcium than whelk. Whelk has 113mg of calcium, while cockles have 30mg. We used Mollusks, whelk, unspecified, cooked, moist heat and Cockles, raw (Alaska Native) types in this comparison.
Infographic
Mineral Comparison
Mineral comparison score is based on the number of minerals by which one or the other food is richer. The "coverage" charts below show how much of the daily needs can be covered by 300 grams of the food.
8
100 g
300 g
3 oz - 85g
Magnesium
Magnesium
Calcium
Calcium
Potassium
Potassium
Iron
Iron
Copper
Copper
Zinc
Zinc
Phosphorus
Phosphorus
Sodium
Sodium
Manganese
Manganese
Selenium
Selenium
123%
34%
61%
377%
687%
89%
121%
54%
116%
489%
2
100 g
300 g
Magnesium
Magnesium
Calcium
Calcium
Potassium
Potassium
Iron
Iron
Copper
Copper
Zinc
Zinc
Phosphorus
Phosphorus
Sodium
Sodium
Manganese
Manganese
Selenium
Selenium
0%
9%
0%
608%
0%
0%
0%
0%
0%
0%
Vitamin Comparison
Vitamin comparison score is based on the number of vitamins by which one or the other food is richer. The "coverage" charts below show how much of the daily needs can be covered by 300 grams of the food.
7
100 g
300 g
3 oz - 85g
Vitamin C
Vit. C
Vitamin D
Vit. D
Vitamin A
Vit. A
Vitamin E
Vit. E
Vitamin B1
Vit. B1
Vitamin B2
Vit. B2
Vitamin B3
Vit. B3
Vitamin B5
Vit. B5
Vitamin B6
Vit. B6
Vitamin B12
Vit. B12
Vitamin K
Vit. K
Folate
Folate
23%
0%
16%
0%
12%
49%
37%
24%
150%
2268%
0%
8.3%
1
100 g
300 g
Vitamin C
Vit. C
Vitamin D
Vit. D
Vitamin A
Vit. A
Vitamin E
Vit. E
Vitamin B1
Vit. B1
Vitamin B2
Vit. B2
Vitamin B3
Vit. B3
Vitamin B5
Vit. B5
Vitamin B6
Vit. B6
Vitamin B12
Vit. B12
Vitamin K
Vit. K
Folate
Folate
0%
0%
0%
0%
2.5%
46%
60%
0%
0%
0%
0%
0%
All nutrients comparison - raw data values
Nutrient
DV% diff.
Vitamin B12
18.14µg
756%
Copper
2.06mg
229%
Selenium
89.6µg
163%
Iron
10.06mg
16.2mg
77%
Protein
47.68g
13.5g
68%
Vitamin B6
0.65mg
50%
Cholesterol
130mg
43%
Magnesium
172mg
41%
Phosphorus
282mg
40%
Manganese
0.89mg
39%
Zinc
3.26mg
30%
Potassium
694mg
20%
Sodium
412mg
18%
Calories
275kcal
79kcal
10%
Vitamin C
6.8mg
8%
Calcium
113mg
30mg
8%
Vitamin B3
1.995mg
3.2mg
8%
Vitamin B5
0.4mg
8%
Vitamin A
49µg
5%
Carbs
15.52g
4.7g
4%
Vitamin B1
0.049mg
0.01mg
3%
Folate
11µg
3%
Vitamin B2
0.214mg
0.2mg
1%
Protein per 100 calories
17g
17g
N/A
Calories per 10 g protein
58kcal
59kcal
N/A
Weight per 100 calories
36g
127g
N/A
Fats
0.8g
0.7g
0%
Net carbs
15.52g
4.7g
N/A
Saturated fat
0.062g
0%
Monounsaturated fat
0.056g
0%
Polyunsaturated fat
0.046g
0%
Tryptophan
0.618mg
0%
Threonine
2.136mg
0%
Isoleucine
1.655mg
0%
Leucine
3.807mg
0%
Lysine
2.93mg
0%
Methionine
1.205mg
0%
Phenylalanine
1.648mg
0%
Valine
2.075mg
0%
Histidine
0.977mg
0%
Omega-3 - EPA
0.008g
N/A
Omega-3 - DHA
0.012g
N/A
Macronutrient Comparison
Macronutrient breakdown side-by-side comparison
4
48%
16%
32%
4%
Protein:
47.68 g
Fats:
0.8 g
Carbs:
15.52 g
Water:
32 g
Other:
4 g
1
14%
5%
79%
2%
Protein:
13.5 g
Fats:
0.7 g
Carbs:
4.7 g
Water:
78.8 g
Other:
2.3 g
Contains
more
Protein Protein
+253.2%
Contains
more
Fats Fats
+14.3%
Contains
more
Carbs Carbs
+230.2%
Contains
more
Other Other
+73.9%
Contains
more
Water Water
+146.3%