Pollock vs. Cod — Health Impact and Nutrition Comparison


Summary
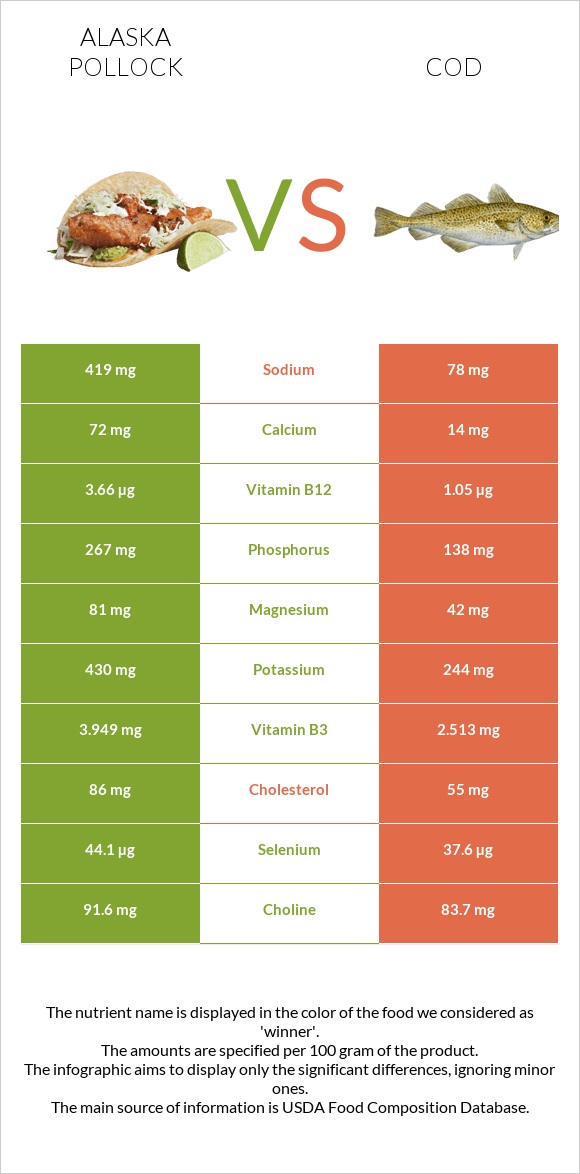
Alaska pollock is richer in protein. Cod is lower in cholesterol, calories, and fats. It contains less sodium than pollock. Alaska pollock are richer in B-complex vitamins, especially in vitamin B12: it covers 458% of the DV of vitamin B12.
Introduction
Cod and Alaska pollock are two of the most famous and world-spread fishes. This article will compare cooked versions of these fish species, focusing on their nutritional content and health impact and showing their actual differences.
Actual differences
Both pollock and cod are different seafood species belonging to the Gadidae family. The Latin name for Alaska pollock is Gadus chalcogramma, and the cod is called Gadus macrocephalus. Alaska pollock are usually cheaper than cod. These fishes also differ in flavor, smell, appearance, texture, and preparation methods.
Alaska pollock are brown-black or olive green on the back and become pale and silvery on the ventral side. It is usually camouflaged with yellow or black spots, while cod has a grey-green or red-brown body with black dots.
What about the flavors? Cod has a non-fishy, mild, and a bit sweet flavor. The taste of pollock is light-mild and delicate. Cod smells very fishy. Sometimes it may have supplement odors like melon and cucumber smells. Fresh pollock has a briny, mild smell.
Both fish can be found in fillets forms.
Alaska pollock have a softer, slightly coarse texture and white flesh with flaky white meat. In contrast, cod has a tender-firm texture.
One of the most common cod fish is the Pacific cod.
Cod is usually prepared in grilled, deep-fried, broiled, or baked form. Tilapia is made by grilling, baking, smoking, and stir-frying.
Nutrition
The following sections of the article will discuss cooked cod and pollock’s macronutrient, vitamin, and mineral composition. Both of them are nutrient rich fish species without any amounts of carbs.
Macronutrient Comparison
Contains
more
FatsFats
+37.2%
Contains
more
OtherOther
+333.3%
Calories
Due to its higher protein and fat composition, Alaska pollock provides slightly more calories than cod. It contains six more calories.
Protein
Pollock is slightly higher in protein than cod. Per 100g serving, pollock provide 23.5 grams of protein, while cod contains 22.8g.
Both of them provide different amounts of essential amino acids, such as histidine, lysine, and phenylalanine.
Fats
Cod has less than one gram of fat per 100g, while the same amount of Alaska pollock provides 1.2g. It is higher in omega-3 fatty acids.
Surprisingly, cod is 31mg lower in cholesterol than Alaska pollock.
Fat Type Comparison
Contains
more
Poly. FatPolyunsaturated fat
+99.7%
Minerals
Alaskan Pollock has a richer mineral profile.
Pollock provides more phosphorus, magnesium, calcium, selenium, copper, potassium, and iron than cod. Cod is lower in sodium than pollock. You can see the mineral comparison chart below.
Mineral Comparison
Contains
more
MagnesiumMagnesium
+92.9%
Contains
more
CalciumCalcium
+414.3%
Contains
more
PotassiumPotassium
+76.2%
Contains
more
IronIron
+14.3%
Contains
more
CopperCopper
+66.7%
Contains
more
PhosphorusPhosphorus
+93.5%
Contains
more
SeleniumSelenium
+17.3%
Contains
less
SodiumSodium
-81.4%
Contains
more
ManganeseManganese
+11.1%
Vitamins
In general, Alaska pollock has higher vitamin content than cod. Cod contains vitamin C, which is not present in pollock. Pollock is higher in B-complex vitamins. 100g of Alaska pollock covers 458% of the DV of vitamin B12.
Vitamin Comparison
Contains
more
Vitamin AVitamin A
+21.4%
Contains
more
Vitamin B2Vitamin B2
+182.3%
Contains
more
Vitamin B3Vitamin B3
+57.1%
Contains
more
Vitamin B5Vitamin B5
+140%
Contains
more
Vitamin B6Vitamin B6
+16.3%
Contains
more
Vitamin B12Vitamin B12
+248.6%
Contains
more
Vitamin CVitamin C
+∞%
Contains
more
Vitamin EVitamin E
+189.3%
Contains
more
Vitamin B1Vitamin B1
+63%
Contains
more
FolateFolate
+166.7%
Health benefits
Cardiovascular health and omega fatty acids
Consuming Alaska pollock and cod is associated with a lower risk of cardiovascular disease (1). The proportion of omega-3 to omega-6 fatty acids is responsible for this. The human body cannot produce these long-chain essential fatty acids. We have to get them from some food products as a result. A study found that when blood flow quantities of omega-6 and omega-3 fatty acids are out of balance, the risk of heart disease rises (2). Thus, eating fish can support a balanced diet.
Mercury poisoning
Alaska pollock is categorized as a food that contains moderate amounts of mercury. Mercury is poisonous to children, young people, and pregnant women, even if it is safe for healthy middle-aged individuals (3). Cod is a better option to avoid mercury poisoning because it has less mercury than Alaska pollock (4).
Inflammatory markers
Consumption of cod is associated with decreased levels of neopterin, which is a pro-inflammatory marker. Indicating lower levels of inflammation. (5)
Metabolic markers
Consumption of cod is associated with lower levels of postprandial glucose and blood lipid levels. Overall, having a positive effect on our metabolism. The limitation of this study is that it was done on rats and not in clinical trials. (6)
When it comes to hyperglycemia in diabetes, pollock consumption is linked with better health outcomes in type 2 diabetic patients by overall reducing glucose spikes. (7)
Dementia
Pollock consumption is linked with protective functions against short-term memory decline with age.
You can also read about Cod vs. Tilapia in this article.
References
- https://www.ncbi.nlm.nih.gov/pmc/articles/PMC7468748/
- https://pubmed.ncbi.nlm.nih.gov/34371930/
- https://www.ncbi.nlm.nih.gov/pmc/articles/PMC2954077/
- https://www.fda.gov/food/environmental-contaminants-food/mercury-levels-commercial-fish-and-shellfish-1990-2012
- https://pubmed.ncbi.nlm.nih.gov/33576844/
- https://pubmed.ncbi.nlm.nih.gov/25380663/
- https://pubmed.ncbi.nlm.nih.gov/32885439/
- https://pubmed.ncbi.nlm.nih.gov/36364879/

Infographic
All nutrients comparison - raw data values
| Nutrient | |
|
DV% diff. |
| Vitamin B12 | 3.66µg | 1.05µg | 109% |
| Phosphorus | 267mg | 138mg | 18% |
| Sodium | 419mg | 78mg | 15% |
| Selenium | 44.1µg | 37.6µg | 12% |
| Vitamin B2 | 0.223mg | 0.079mg | 11% |
| Cholesterol | 86mg | 55mg | 10% |
| Magnesium | 81mg | 42mg | 9% |
| Vitamin B3 | 3.949mg | 2.513mg | 9% |
| Calcium | 72mg | 14mg | 6% |
| Potassium | 430mg | 244mg | 5% |
| Vitamin B5 | 0.432mg | 0.18mg | 5% |
| Vitamin E | 0.28mg | 0.81mg | 4% |
| Vitamin B6 | 0.329mg | 0.283mg | 4% |
| Copper | 0.06mg | 0.036mg | 3% |
| Vitamin B1 | 0.054mg | 0.088mg | 3% |
| Polyunsaturated fat | 0.583g | 0.292g | 2% |
| Protein | 23.48g | 22.83g | 1% |
| Vitamin C | 0mg | 1mg | 1% |
| Vitamin D* | 51 IU | 46 IU | 1% |
| Vitamin D | 1.3µg | 1.2µg | 1% |
| Iron | 0.56mg | 0.49mg | 1% |
| Folate | 3µg | 8µg | 1% |
| Choline | 91.6mg | 83.7mg | 1% |
| Calories | 111kcal | 105kcal | 0% |
| Protein per 100 calories | 21g | 22g | N/A |
| Calories per 10 g protein | 47kcal | 46kcal | N/A |
| Weight per 100 calories | 90g | 95g | N/A |
| Fats | 1.18g | 0.86g | 0% |
| Zinc | 0.57mg | 0.58mg | 0% |
| Vitamin A | 17µg | 14µg | 0% |
| Manganese | 0.018mg | 0.02mg | 0% |
| Vitamin K | 0.1µg | 0.1µg | 0% |
| Saturated fat | 0.159g | 0.168g | 0% |
| Monounsaturated fat | 0.134g | 0.124g | 0% |
| Tryptophan | 0.263mg | 0.256mg | 0% |
| Threonine | 1.029mg | 1.001mg | 0% |
| Isoleucine | 1.082mg | 1.052mg | 0% |
| Leucine | 1.908mg | 1.856mg | 0% |
| Lysine | 2.157mg | 2.097mg | 0% |
| Methionine | 0.696mg | 0.676mg | 0% |
| Phenylalanine | 0.917mg | 0.891mg | 0% |
| Valine | 1.21mg | 1.176mg | 0% |
| Histidine | 0.691mg | 0.672mg | 0% |
| Omega-3 - EPA | 0.086g | 0.004g | N/A |
| Omega-3 - DHA | 0.423g | 0.154g | N/A |
| Omega-3 - DPA | 0.027g | 0.013g | N/A |
People also compare


References
All the values for which the sources are not specified explicitly are taken from FDA’s Food Central. The exact link to the food presented on this page can be found below.
- Pollock - https://fdc.nal.usda.gov/fdc-app.html#/food-details/173681/nutrients
- Cod - https://fdc.nal.usda.gov/fdc-app.html#/food-details/171956/nutrients
All the Daily Values are presented for males aged 31-50, for 2000-calorie diets.