Cod vs. Tilapia — Health Impact and Nutrition Comparison


Summary
Tilapia is richer in protein, fats, and calories. Cod is lower in saturated fat. It contains two times more vitamin B6 than tilapia. Tilapia is richer in vitamin B12: it covers 233% of the DV of vitamin B12. Cod is lower in mercury, a better choice to avoid mercury poisoning.
Introduction
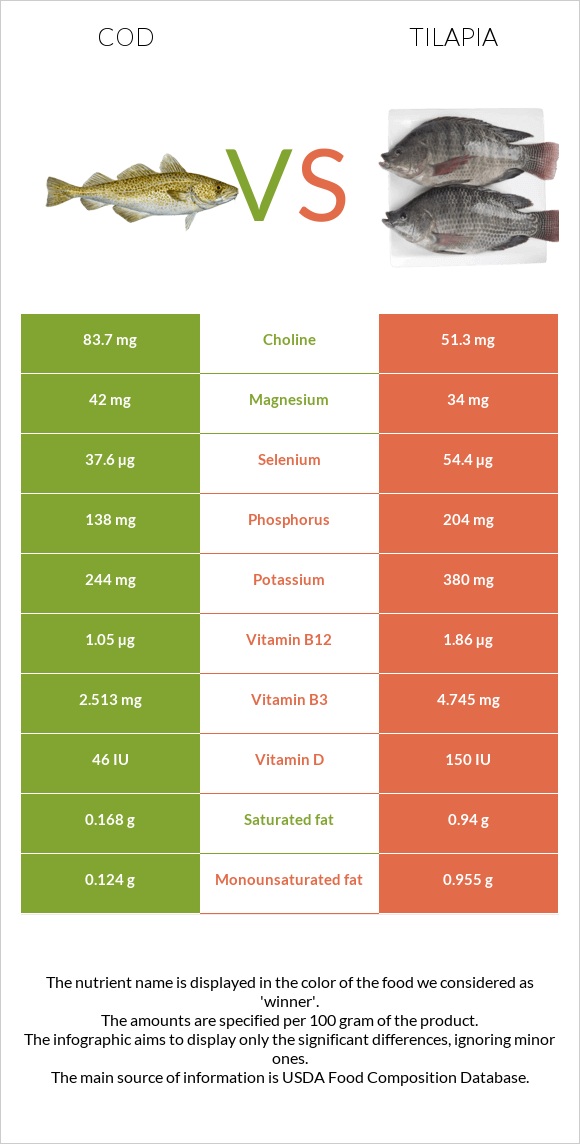
Cod (1) and tilapia (2) are the most famous fishes. In this article, we will compare cooked versions of these fish species, focusing on their nutritional composition and health impact and showing their differences.
The food types used in this article are Atlantic Cod (cooked, dry heat) and Tilapia (cooked, dry heat).
Actual differences
The common word "tilapia" refers to freshwater fish from the cichlid family. Cod is a name for a demersal fish from the genus Gadus. These fishes differ in appearance, taste, smell, texture, and preparation methods.
Tilapia has a black, red, or gold, deep body, and long dorsal fins, while cod is red-brown or grey-green with black dots and has dorsal and anal fins.
Does Cod Taste Like Tilapia?
Regarding flavors, cod has a mild, non-fishy, and a bit sweet taste. The taste of tilapia depends on the environment it is grown in: usually, good-quality tilapia has a sweet and mild flavor.
Tilapia has a firm and flaky texture and white flesh, while cod has a tender-firm texture.
Cod is usually grilled, baked, deep-fried, or broiled. Tilapia is prepared by steaming, grilling, baking, smoking, poaching, and stir-frying.
Generally, high-quality farmed tilapia tastes better than wild tilapia that feed on algae and lake plants.
Substitution
If you desire a mild-flavored alternative to cod, they can use tilapia as a substitute and find the same level of satisfaction. Tilapia is a versatile fish that complements various sauces, herbs, and spices, making it a suitable replacement for cod or other white fish like haddock, catfish, grouper fish, and halibut in dishes like fish and chips, fish tacos, or fish sandwiches. Both tilapia and cod can be cooked using similar methods, such as baking, grilling, broiling, and pan-frying. There is no need to adjust the recipe when substituting cod with tilapia, as they cook in similar amounts of time.
Nutrition
This part of the article will discuss cod and tilapia's macronutrient, mineral, and vitamin composition. Both of them are nutritious fish without any quantities of carbs.
Macronutrient Comparison
Contains
more
OtherOther
+∞%
Contains
more
ProteinProtein
+14.5%
Contains
more
FatsFats
+208.1%
Calories
Due to its higher protein and fat composition, tilapia provides slightly more calories than cod. It has 23 calories more.
Protein
Tilapia is higher in protein than cod. Per 100g serving, tilapia provides 26.2 grams of protein, while cod contains 22.8g.
Both contain essential amino acids, such as histidine, lysine, and phenylalanine.
Fats
Cod contains less than one gram of fat per 100g, while the same amount of tilapia provides 2.7g. It is higher in both omega-3 and omega-6 fatty acids.
The difference in cholesterol amounts is not significant.
Fat Type Comparison
Contains
less
Sat. FatSaturated fat
-82.1%
Contains
more
Mono. FatMonounsaturated fat
+670.2%
Contains
more
Poly. FatPolyunsaturated fat
+105.5%
Minerals
The leader in this section is tilapia.
Tilapia provides more phosphorus, copper, potassium, and iron than cod. Cod contains more magnesium and zinc. Tilapia is lower in sodium than cod. Cod and tilapia contain some amounts of mercury, while tilapia provides more selenium (3).
You can check the mineral comparison chart below.
Mineral Comparison
Contains
more
MagnesiumMagnesium
+23.5%
Contains
more
ZincZinc
+41.5%
Contains
more
PotassiumPotassium
+55.7%
Contains
more
IronIron
+40.8%
Contains
more
CopperCopper
+108.3%
Contains
more
PhosphorusPhosphorus
+47.8%
Contains
less
SodiumSodium
-28.2%
Contains
more
ManganeseManganese
+85%
Contains
more
SeleniumSelenium
+44.7%
Vitamins
In general, cod and tilapia have similar vitamin content. Cod contains vitamins C and A that are not present in tilapia. Tilapia contains more vitamins D, K, B5, B12, and niacin (B3).
Vitamin Comparison
Contains
more
Vitamin CVitamin C
+∞%
Contains
more
Vitamin AVitamin A
+∞%
Contains
more
Vitamin B6Vitamin B6
+130.1%
Contains
more
FolateFolate
+33.3%
Contains
more
Vitamin DVitamin D
+208.3%
Contains
more
Vitamin B3Vitamin B3
+88.8%
Contains
more
Vitamin B5Vitamin B5
+268.9%
Contains
more
Vitamin B12Vitamin B12
+77.1%
Contains
more
Vitamin KVitamin K
+800%
Health benefits
Cardiovascular health and omega fatty acids
Tilapia and cod consumption is linked to a reduced risk of cardiovascular disease (4). This is because of the ratio of omega-3 to omega-6 fatty acids. The human body is unable to synthesize these long-chain essential fatty acids. We have to get them through food as a result. According to a study, the risk of heart disease increases when blood flow concentrations of omega-6 and omega-3 fatty acids are out of balance (5). Thus, fish consumption can support a healthy diet.
Inflammation
Omega-3 fatty acids are found in all types of fish but are especially abundant in fatty fish.
Cod is higher in both omega-3 and omega-6 fatty acids. Cod contains omega-3 polyunsaturated fatty acids, which have the most potent immunomodulatory activities of any fatty acid.
The advantage of omega-3 is that it can reduce inflammation, resulting in better muscle recovery, less pain, and better gut health. On the other hand, while omega-6 fatty acids are necessary, a high intake causes more inflammation in the body. An increase in inflammation can result in poor digestion, poor sleep quality, and weight gain.
Because your body cannot produce omega-3 fatty acids such as eicosapentaenoic acid (EPA), docosahexaenoic acid (DHA), and alpha-linolenic acid (ALA), you must obtain them through your diet (6).
Health risks
Mercury poisoning
Tilapia is classified as food with moderate amounts of mercury. Although mercury is not harmful to healthy middle-aged people, it can be toxic to children, young people, and pregnant women (7). Cod is lower in mercury than tilapia, making itself a better choice to avoid mercury poisoning (8).
References
- https://fdc.nal.usda.gov/fdc-app.html#/food-details/171956/nutrients
- https://fdc.nal.usda.gov/fdc-app.html#/food-details/175177/nutrients
- https://www.ncbi.nlm.nih.gov/pmc/articles/PMC6553691/
- https://www.ncbi.nlm.nih.gov/pmc/articles/PMC7468748/
- https://pubmed.ncbi.nlm.nih.gov/34371930/
- https://pubmed.ncbi.nlm.nih.gov/12480795/
- https://www.ncbi.nlm.nih.gov/pmc/articles/PMC2954077/
- https://www.fda.gov/food/environmental-contaminants-food/mercury-levels-commercial-fish-and-shellfish-1990-2012

Infographic
All nutrients comparison - raw data values
| Nutrient | |
|
DV% diff. |
| Vitamin B12 | 1.05µg | 1.86µg | 34% |
| Selenium | 37.6µg | 54.4µg | 31% |
| Vitamin B3 | 2.513mg | 4.745mg | 14% |
| Vitamin D* | 46 IU | 150 IU | 13% |
| Vitamin D | 1.2µg | 3.7µg | 13% |
| Vitamin B6 | 0.283mg | 0.123mg | 12% |
| Vitamin B5 | 0.18mg | 0.664mg | 10% |
| Phosphorus | 138mg | 204mg | 9% |
| Protein | 22.83g | 26.15g | 7% |
| Choline | 83.7mg | 51.3mg | 6% |
| Potassium | 244mg | 380mg | 4% |
| Copper | 0.036mg | 0.075mg | 4% |
| Saturated fat | 0.168g | 0.94g | 4% |
| Fats | 0.86g | 2.65g | 3% |
| Iron | 0.49mg | 0.69mg | 3% |
| Magnesium | 42mg | 34mg | 2% |
| Zinc | 0.58mg | 0.41mg | 2% |
| Vitamin A | 14µg | 0µg | 2% |
| Monounsaturated fat | 0.124g | 0.955g | 2% |
| Polyunsaturated fat | 0.292g | 0.6g | 2% |
| Calories | 105kcal | 128kcal | 1% |
| Vitamin C | 1mg | 0mg | 1% |
| Cholesterol | 55mg | 57mg | 1% |
| Sodium | 78mg | 56mg | 1% |
| Manganese | 0.02mg | 0.037mg | 1% |
| Vitamin K | 0.1µg | 0.9µg | 1% |
| Folate | 8µg | 6µg | 1% |
| Protein per 100 calories | 22g | 20g | N/A |
| Calories per 10 g protein | 46kcal | 49kcal | N/A |
| Weight per 100 calories | 95g | 78g | N/A |
| Unsaturated / Saturated Fat ratio | 2.5 | 1.7 | N/A |
| Calcium | 14mg | 14mg | 0% |
| Vitamin E | 0.81mg | 0.79mg | 0% |
| Vitamin B1 | 0.088mg | 0.093mg | 0% |
| Vitamin B2 | 0.079mg | 0.073mg | 0% |
| Tryptophan | 0.256mg | 0.265mg | 0% |
| Threonine | 1.001mg | 1.156mg | 0% |
| Isoleucine | 1.052mg | 1.22mg | 0% |
| Leucine | 1.856mg | 2.04mg | 0% |
| Lysine | 2.097mg | 2.315mg | 0% |
| Methionine | 0.676mg | 0.766mg | 0% |
| Phenylalanine | 0.891mg | 1.05mg | 0% |
| Valine | 1.176mg | 1.28mg | 0% |
| Histidine | 0.672mg | 0.585mg | 0% |
| Omega-3 - EPA | 0.004g | 0.005g | N/A |
| Omega-3 - DHA | 0.154g | 0.13g | N/A |
| Omega-3 - ALA | 0.045g | N/A | |
| Omega-3 - DPA | 0.013g | 0.06g | N/A |
| Omega-6 - Eicosadienoic acid | 0.015g | N/A |
People also compare


References
All the values for which the sources are not specified explicitly are taken from FDA’s Food Central. The exact link to the food presented on this page can be found below.
- Cod - https://fdc.nal.usda.gov/fdc-app.html#/food-details/171956/nutrients
- Tilapia - https://fdc.nal.usda.gov/fdc-app.html#/food-details/175177/nutrients
All the Daily Values are presented for males aged 31-50, for 2000-calorie diets.