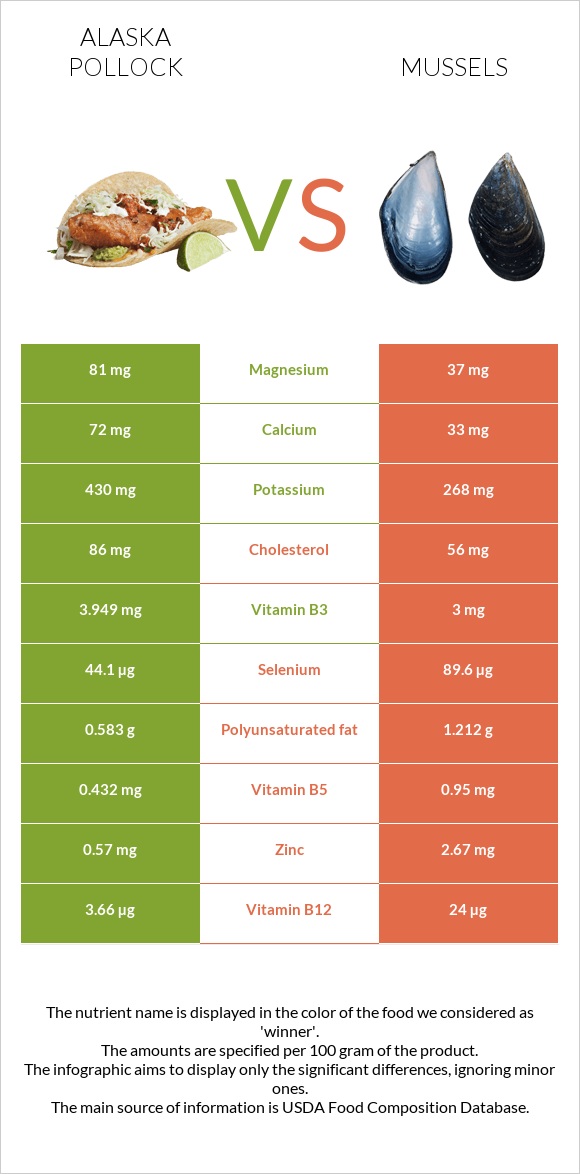
Important differences between pollock and mussels Pollock has more vitamin B6; however, mussels has more vitamin B12, manganese, selenium, iron, vitamin B1, zinc, folate, vitamin B2, and vitamin C. Mussels's daily need coverage for vitamin B12 is 848% more. Pollock has 3 times more vitamin B6 than mussels. Pollock has 0.329mg of vitamin B6, while mussels has 0.1mg. Mussels has a higher glycemic index than pollock. The food varieties used in the comparison are Fish, pollock, Alaska, cooked, dry heat (may have been previously frozen) and Mollusks, mussel, blue, cooked, moist heat .
Infographic
Mineral Comparison
Mineral comparison score is based on the number of minerals by which one or the other food is richer. The "coverage" charts below show how much of the daily needs can be covered by 300 grams of the food.
3
100 g
300 g
1 fillet - 60g 3 oz - 85g
Magnesium
Magnesium
Calcium
Calcium
Potassium
Potassium
Iron
Iron
Copper
Copper
Zinc
Zinc
Phosphorus
Phosphorus
Sodium
Sodium
Manganese
Manganese
Selenium
Selenium
58%
22%
38%
21%
20%
16%
114%
55%
2.3%
241%
6
100 g
300 g
3 oz - 85g
Magnesium
Magnesium
Calcium
Calcium
Potassium
Potassium
Iron
Iron
Copper
Copper
Zinc
Zinc
Phosphorus
Phosphorus
Sodium
Sodium
Manganese
Manganese
Selenium
Selenium
26%
9.9%
24%
252%
50%
73%
122%
48%
887%
489%
Vitamin Comparison
Vitamin comparison score is based on the number of vitamins by which one or the other food is richer. The "coverage" charts below show how much of the daily needs can be covered by 300 grams of the food.
5
100 g
300 g
1 fillet - 60g 3 oz - 85g
Vitamin C
Vit. C
Vitamin D
Vit. D
Vitamin A
Vit. A
Vitamin E
Vit. E
Vitamin B1
Vit. B1
Vitamin B2
Vit. B2
Vitamin B3
Vit. B3
Vitamin B5
Vit. B5
Vitamin B6
Vit. B6
Vitamin B12
Vit. B12
Vitamin K
Vit. K
Folate
Folate
0%
20%
5.7%
5.6%
14%
51%
74%
26%
76%
458%
0.25%
2.3%
7
100 g
300 g
3 oz - 85g
Vitamin C
Vit. C
Vitamin D
Vit. D
Vitamin A
Vit. A
Vitamin E
Vit. E
Vitamin B1
Vit. B1
Vitamin B2
Vit. B2
Vitamin B3
Vit. B3
Vitamin B5
Vit. B5
Vitamin B6
Vit. B6
Vitamin B12
Vit. B12
Vitamin K
Vit. K
Folate
Folate
45%
0%
30%
0%
75%
97%
56%
57%
23%
3000%
0%
57%
All nutrients comparison - raw data values
Nutrient
DV% diff.
Vitamin B12
3.66µg
24µg
848%
Manganese
0.018mg
6.8mg
295%
Selenium
44.1µg
89.6µg
83%
Iron
0.56mg
6.72mg
77%
Vitamin B1
0.054mg
0.3mg
21%
Zinc
0.57mg
2.67mg
19%
Vitamin B6
0.329mg
0.1mg
18%
Folate
3µg
76µg
18%
Choline
91.6mg
17%
Vitamin C
0mg
13.6mg
15%
Vitamin B2
0.223mg
0.42mg
15%
Cholesterol
86mg
56mg
10%
Magnesium
81mg
37mg
10%
Copper
0.06mg
0.149mg
10%
Vitamin B5
0.432mg
0.95mg
10%
Vitamin A
17µg
91µg
8%
Vitamin D
1.3µg
7%
Vitamin D*
51 IU
6%
Vitamin B3
3.949mg
3mg
6%
Fats
1.18g
4.48g
5%
Potassium
430mg
268mg
5%
Calcium
72mg
33mg
4%
Polyunsaturated fat
0.583g
1.212g
4%
Calories
111kcal
172kcal
3%
Phosphorus
267mg
285mg
3%
Saturated fat
0.159g
0.85g
3%
Carbs
0g
7.39g
2%
Sodium
419mg
369mg
2%
Vitamin E
0.28mg
2%
Monounsaturated fat
0.134g
1.014g
2%
Protein
23.48g
23.8g
1%
Protein per 100 calories
21g
14g
N/A
Calories per 10 g protein
47kcal
72kcal
N/A
Weight per 100 calories
90g
58g
N/A
Unsaturated / Saturated Fat ratio
4.5
2.6
N/A
Net carbs
0g
7.39g
N/A
Vitamin K
0.1µg
0%
Tryptophan
0.263mg
0.267mg
0%
Threonine
1.029mg
1.025mg
0%
Isoleucine
1.082mg
1.036mg
0%
Leucine
1.908mg
1.676mg
0%
Lysine
2.157mg
1.779mg
0%
Methionine
0.696mg
0.537mg
0%
Phenylalanine
0.917mg
0.853mg
0%
Valine
1.21mg
1.04mg
0%
Histidine
0.691mg
0.457mg
0%
Omega-3 - EPA
0.086g
0.276g
N/A
Omega-3 - DHA
0.423g
0.506g
N/A
Omega-3 - DPA
0.027g
0.044g
N/A
Macronutrient Comparison
Macronutrient breakdown side-by-side comparison
1
23%
74%
2%
Protein:
23.48 g
Fats:
1.18 g
Carbs:
0 g
Water:
73.65 g
Other:
1.69 g
4
24%
4%
7%
61%
3%
Protein:
23.8 g
Fats:
4.48 g
Carbs:
7.39 g
Water:
61.15 g
Other:
3.18 g
Contains
more
Water Water
+20.4%
Contains
more
Fats Fats
+279.7%
Contains
more
Carbs Carbs
+∞%
Contains
more
Other Other
+88.2%
Fat Type Comparison
Fat type breakdown side-by-side comparison
1
18%
15%
67%
Saturated fat:
Sat. Fat
0.159 g
Monounsaturated fat:
Mono. Fat
0.134 g
Polyunsaturated fat:
Poly. Fat
0.583 g
2
28%
33%
39%
Saturated fat:
Sat. Fat
0.85 g
Monounsaturated fat:
Mono. Fat
1.014 g
Polyunsaturated fat:
Poly. Fat
1.212 g
Contains
less
Sat. Fat Saturated fat
-81.3%
Contains
more
Mono. Fat Monounsaturated fat
+656.7%
Contains
more
Poly. Fat Polyunsaturated fat
+107.9%