Balsamic vinegar vs. Crab stick — In-Depth Nutrition Comparison
Compare
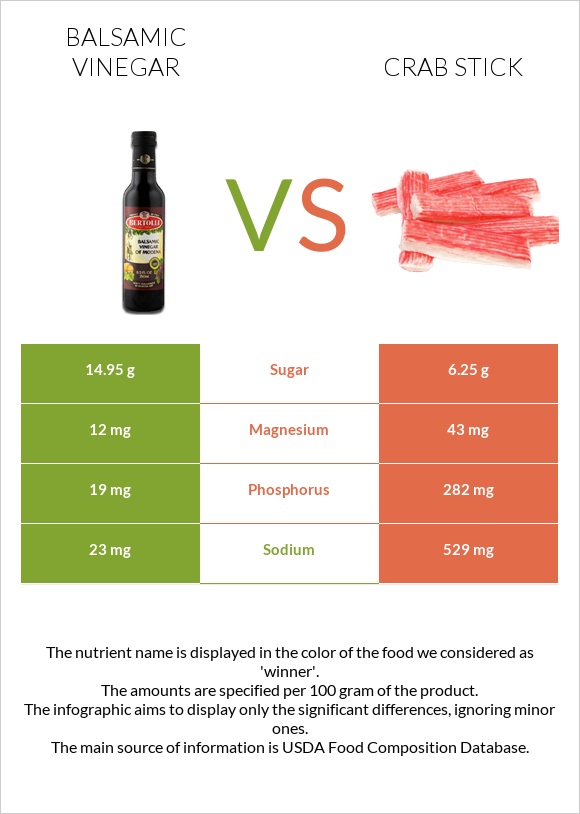
What are the differences between balsamic vinegar and crab stick?
- Balsamic vinegar is higher in manganese; however, crab stick is richer in phosphorus and magnesium.
- Crab stick's daily need coverage for phosphorus is 38% more.
- Crab stick contains 12 times less manganese than balsamic vinegar. Balsamic vinegar contains 0.131mg of manganese, while crab stick contains 0.011mg.
- Crab stick has less sugar.
We used Vinegar, balsamic and Crustaceans, crab, alaska king, imitation, made from surimi types in this article.
Infographic
Infographic link
Mineral Comparison
Mineral comparison score is based on the number of minerals by which one or the other food is richer. The "coverage" charts below show how much of the daily needs can be covered by 300 grams of the food.
| Contains more CalciumCalcium | +107.7% |
| Contains more PotassiumPotassium | +24.4% |
| Contains more IronIron | +84.6% |
| Contains less SodiumSodium | -95.7% |
| Contains more ManganeseManganese | +1090.9% |
| Contains more MagnesiumMagnesium | +258.3% |
| Contains more CopperCopper | +23.1% |
| Contains more ZincZinc | +312.5% |
| Contains more PhosphorusPhosphorus | +1384.2% |
Vitamin Comparison
Vitamin comparison score is based on the number of vitamins by which one or the other food is richer. The "coverage" charts below show how much of the daily needs can be covered by 300 grams of the food.
All nutrients comparison - raw data values
| Nutrient |  |
 |
DV% diff. |
| Selenium | 22.3µg | 41% | |
| Phosphorus | 19mg | 282mg | 38% |
| Vitamin B12 | 0.57µg | 24% | |
| Sodium | 23mg | 529mg | 22% |
| Protein | 0.49g | 7.62g | 14% |
| Vitamin B6 | 0.13mg | 10% | |
| Fructose | 7.38g | 0.62g | 8% |
| Cholesterol | 20mg | 7% | |
| Magnesium | 12mg | 43mg | 7% |
| Vitamin B2 | 0.08mg | 6% | |
| Manganese | 0.131mg | 0.011mg | 5% |
| Iron | 0.72mg | 0.39mg | 4% |
| Vitamin B3 | 0.62mg | 4% | |
| Vitamin B1 | 0.03mg | 3% | |
| Fiber | 0.5g | 2% | |
| Zinc | 0.08mg | 0.33mg | 2% |
| Choline | 13mg | 2% | |
| Fats | 0g | 0.46g | 1% |
| Carbs | 17.03g | 15g | 1% |
| Calcium | 27mg | 13mg | 1% |
| Potassium | 112mg | 90mg | 1% |
| Copper | 0.026mg | 0.032mg | 1% |
| Starch | 3.5g | 1% | |
| Vitamin E | 0.17mg | 1% | |
| Saturated fat | 0g | 0.216g | 1% |
| Monounsaturated fat | 0.275g | 1% | |
| Polyunsaturated fat | 0.143g | 1% | |
| Calories | 88kcal | 95kcal | 0% |
| Net carbs | 17.03g | 14.5g | N/A |
| Sugar | 14.95g | 6.25g | N/A |
| Vitamin K | 0.4µg | 0% | |
| Trans fat | 0g | 0.008g | N/A |
| Tryptophan | 0.075mg | 0% | |
| Threonine | 0.285mg | 0% | |
| Isoleucine | 0.23mg | 0% | |
| Leucine | 0.607mg | 0% | |
| Lysine | 0.707mg | 0% | |
| Methionine | 0.261mg | 0% | |
| Phenylalanine | 0.26mg | 0% | |
| Valine | 0.286mg | 0% | |
| Histidine | 0.156mg | 0% | |
| Omega-3 - DHA | 0.028g | N/A | |
| Omega-3 - ALA | 0.008g | N/A | |
| Omega-3 - DPA | 0.001g | N/A | |
| Omega-6 - Linoleic acid | 0.089g | N/A |
Macronutrient Comparison
Macronutrient breakdown side-by-side comparison
Protein:
0.49 g
Fats:
0 g
Carbs:
17.03 g
Water:
76.45 g
Other:
6.03 g
Protein:
7.62 g
Fats:
0.46 g
Carbs:
15 g
Water:
74.66 g
Other:
2.26 g
| Contains more CarbsCarbs | +13.5% |
| Contains more OtherOther | +166.8% |
| Contains more ProteinProtein | +1455.1% |
| Contains more FatsFats | +∞% |
~equal in
Water
~74.66g
Carbohydrate type comparison
Carbohydrate type breakdown side-by-side comparison
Starch:
0 g
Sucrose:
0 g
Glucose:
7.57 g
Fructose:
7.38 g
Lactose:
0 g
Maltose:
0 g
Galactose:
0 g
Starch:
3.5 g
Sucrose:
2.95 g
Glucose:
2.68 g
Fructose:
0.62 g
Lactose:
0 g
Maltose:
0 g
Galactose:
0 g
| Contains more GlucoseGlucose | +182.5% |
| Contains more FructoseFructose | +1090.3% |
| Contains more StarchStarch | +∞% |
| Contains more SucroseSucrose | +∞% |
~equal in
Lactose
~0g
~equal in
Maltose
~0g
~equal in
Galactose
~0g


