Balsamic vinegar vs. Hash browns — In-Depth Nutrition Comparison
Compare
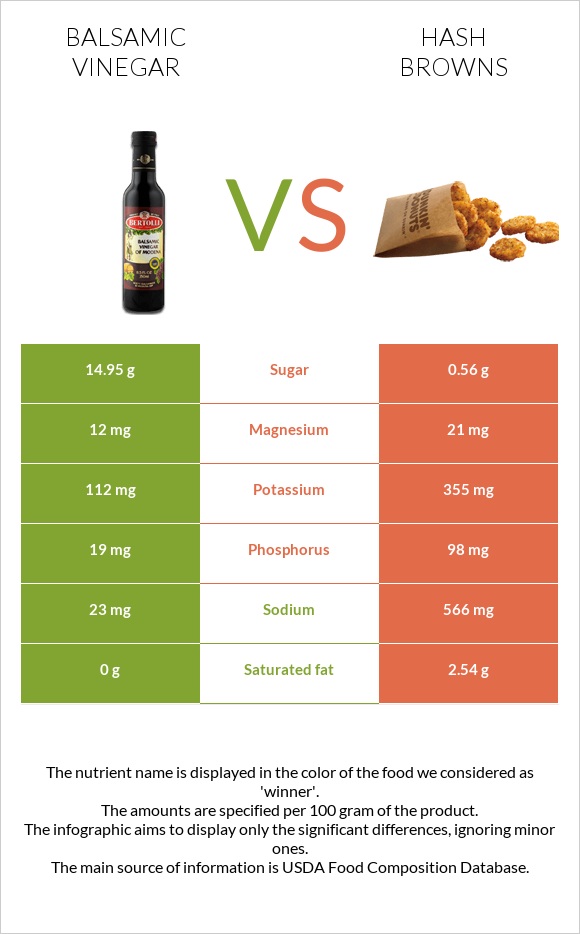
A recap on the differences between balsamic vinegar and hash browns
- Hash browns are higher than balsamic vinegar in phosphorus, copper, potassium, and vitamin C.
- Hash browns cover your daily sodium needs 24% more than balsamic vinegar.
- Balsamic vinegar contains 27 times more sugar than hash browns. While balsamic vinegar contains 14.95g of sugar, hash browns contain only 0.56g.
Food varieties used in this article are Vinegar, balsamic and Fast foods, potatoes, hash browns, round pieces or patty.
Infographic
Infographic link
Mineral Comparison
Mineral comparison score is based on the number of minerals by which one or the other food is richer. The "coverage" charts below show how much of the daily needs can be covered by 300 grams of the food.
| Contains more CalciumCalcium | +42.1% |
| Contains more IronIron | +20% |
| Contains less SodiumSodium | -95.9% |
| Contains more MagnesiumMagnesium | +75% |
| Contains more PotassiumPotassium | +217% |
| Contains more CopperCopper | +284.6% |
| Contains more ZincZinc | +350% |
| Contains more PhosphorusPhosphorus | +415.8% |
| Contains more ManganeseManganese | +20.6% |
Vitamin Comparison
Vitamin comparison score is based on the number of vitamins by which one or the other food is richer. The "coverage" charts below show how much of the daily needs can be covered by 300 grams of the food.
| Contains more Vitamin CVitamin C | +∞% |
All nutrients comparison - raw data values
| Nutrient |  |
 |
DV% diff. |
| Polyunsaturated fat | 5.665g | 38% | |
| Fats | 0g | 17.04g | 26% |
| Sodium | 23mg | 566mg | 24% |
| Monounsaturated fat | 7.827g | 20% | |
| Vitamin E | 2.62mg | 17% | |
| Vitamin B6 | 0.186mg | 14% | |
| Saturated fat | 0g | 2.54g | 12% |
| Fiber | 2.7g | 11% | |
| Starch | 25.74g | 11% | |
| Phosphorus | 19mg | 98mg | 11% |
| Vitamin B1 | 0.137mg | 11% | |
| Vitamin B3 | 1.838mg | 11% | |
| Calories | 88kcal | 272kcal | 9% |
| Fructose | 7.38g | 0.24g | 9% |
| Copper | 0.026mg | 0.1mg | 8% |
| Vitamin B5 | 0.38mg | 8% | |
| Vitamin K | 9.9µg | 8% | |
| Potassium | 112mg | 355mg | 7% |
| Vitamin C | 0mg | 5.4mg | 6% |
| Protein | 0.49g | 2.58g | 4% |
| Carbs | 17.03g | 28.88g | 4% |
| Zinc | 0.08mg | 0.36mg | 3% |
| Vitamin B2 | 0.038mg | 3% | |
| Folate | 12µg | 3% | |
| Choline | 17.8mg | 3% | |
| Magnesium | 12mg | 21mg | 2% |
| Iron | 0.72mg | 0.6mg | 2% |
| Calcium | 27mg | 19mg | 1% |
| Manganese | 0.131mg | 0.158mg | 1% |
| Selenium | 0.4µg | 1% | |
| Net carbs | 17.03g | 26.18g | N/A |
| Sugar | 14.95g | 0.56g | N/A |
| Trans fat | 0g | 0.056g | N/A |
| Omega-3 - ALA | 0.441g | N/A | |
| Omega-6 - Gamma-linoleic acid | 0.03g | N/A | |
| Omega-6 - Eicosadienoic acid | 0.008g | N/A | |
| Omega-6 - Linoleic acid | 5.131g | N/A |
Macronutrient Comparison
Macronutrient breakdown side-by-side comparison
Protein:
0.49 g
Fats:
0 g
Carbs:
17.03 g
Water:
76.45 g
Other:
6.03 g
Protein:
2.58 g
Fats:
17.04 g
Carbs:
28.88 g
Water:
49.27 g
Other:
2.23 g
| Contains more WaterWater | +55.2% |
| Contains more OtherOther | +170.4% |
| Contains more ProteinProtein | +426.5% |
| Contains more FatsFats | +∞% |
| Contains more CarbsCarbs | +69.6% |
Carbohydrate type comparison
Carbohydrate type breakdown side-by-side comparison
Starch:
0 g
Sucrose:
0 g
Glucose:
7.57 g
Fructose:
7.38 g
Lactose:
0 g
Maltose:
0 g
Galactose:
0 g
Starch:
25.74 g
Sucrose:
0 g
Glucose:
0.31 g
Fructose:
0.24 g
Lactose:
0 g
Maltose:
0 g
Galactose:
0 g
| Contains more GlucoseGlucose | +2341.9% |
| Contains more FructoseFructose | +2975% |
| Contains more StarchStarch | +∞% |
~equal in
Sucrose
~0g
~equal in
Lactose
~0g
~equal in
Maltose
~0g
~equal in
Galactose
~0g


