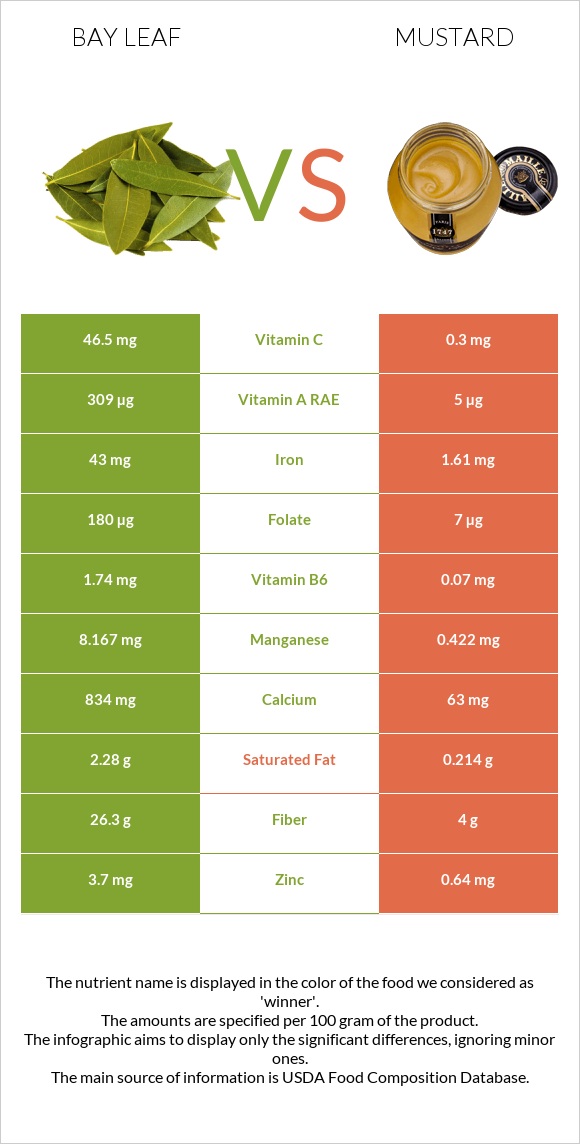
Significant differences between bay leaf and mustard Bay leaf has more iron, manganese, vitamin B6, vitamin A, fiber, calcium, vitamin C, and folate; however, mustard is richer in selenium. Bay leaf covers your daily iron needs 517% more than mustard. Mustard has 155 times less vitamin C than bay leaf. Bay leaf has 46.5mg of vitamin C, while mustard has 0.3mg. Bay leaf contains less sodium. Specific food types used in this comparison are Spices, bay leaf and Mustard, prepared, yellow .
Infographic
Mineral Comparison
Mineral comparison score is based on the number of minerals by which one or the other food is richer. The "coverage" charts below show how much of the daily needs can be covered by 300 grams of the food.
8
100 g
300 g
1 tsp, crumbled - 0.6g 1 tbsp, crumbled - 1.8g
Magnesium
Magnesium
Calcium
Calcium
Potassium
Potassium
Iron
Iron
Copper
Copper
Zinc
Zinc
Phosphorus
Phosphorus
Sodium
Sodium
Manganese
Manganese
Selenium
Selenium
86%
250%
47%
1613%
139%
101%
48%
3%
1065%
15%
1
100 g
300 g
1 tsp or 1 packet - 5g 1 cup - 249g
Magnesium
Magnesium
Calcium
Calcium
Potassium
Potassium
Iron
Iron
Copper
Copper
Zinc
Zinc
Phosphorus
Phosphorus
Sodium
Sodium
Manganese
Manganese
Selenium
Selenium
34%
19%
13%
60%
25%
17%
46%
144%
55%
183%
Vitamin Comparison
Vitamin comparison score is based on the number of vitamins by which one or the other food is richer. The "coverage" charts below show how much of the daily needs can be covered by 300 grams of the food.
6
100 g
300 g
1 tsp, crumbled - 0.6g 1 tbsp, crumbled - 1.8g
Vitamin C
Vit. C
Vitamin D
Vit. D
Vitamin A
Vit. A
Vitamin E
Vit. E
Vitamin B1
Vit. B1
Vitamin B2
Vit. B2
Vitamin B3
Vit. B3
Vitamin B5
Vit. B5
Vitamin B6
Vit. B6
Vitamin B12
Vit. B12
Vitamin K
Vit. K
Folate
Folate
155%
0%
103%
0%
2.3%
97%
38%
0%
402%
0%
0%
135%
4
100 g
300 g
1 tsp or 1 packet - 5g 1 cup - 249g
Vitamin C
Vit. C
Vitamin D
Vit. D
Vitamin A
Vit. A
Vitamin E
Vit. E
Vitamin B1
Vit. B1
Vitamin B2
Vit. B2
Vitamin B3
Vit. B3
Vitamin B5
Vit. B5
Vitamin B6
Vit. B6
Vitamin B12
Vit. B12
Vitamin K
Vit. K
Folate
Folate
1%
0%
1.7%
7.2%
44%
16%
11%
15%
16%
0%
3.5%
5.3%
All nutrients comparison - raw data values
Nutrient
DV% diff.
Iron
43mg
1.61mg
517%
Manganese
8.167mg
0.422mg
337%
Vitamin B6
1.74mg
0.07mg
128%
Fiber
26.3g
4g
89%
Calcium
834mg
63mg
77%
Selenium
2.8µg
33.5µg
56%
Vitamin C
46.5mg
0.3mg
51%
Sodium
23mg
1104mg
47%
Folate
180µg
7µg
43%
Copper
0.416mg
0.074mg
38%
Vitamin A
309µg
5µg
34%
Zinc
3.7mg
0.64mg
28%
Vitamin B2
0.421mg
0.07mg
27%
Carbs
74.97g
5.83g
23%
Magnesium
120mg
48mg
17%
Vitamin B1
0.009mg
0.177mg
14%
Calories
313kcal
60kcal
13%
Potassium
529mg
152mg
11%
Polyunsaturated fat
2.29g
0.774g
10%
Vitamin B3
2.005mg
0.565mg
9%
Saturated fat
2.28g
0.214g
9%
Protein
7.61g
3.74g
8%
Fats
8.36g
3.34g
8%
Vitamin B5
0.254mg
5%
Choline
22.4mg
4%
Vitamin E
0.36mg
2%
Phosphorus
113mg
108mg
1%
Vitamin K
1.4µg
1%
Monounsaturated fat
1.64g
2.182g
1%
Protein per 100 calories
2.4g
6.2g
N/A
Calories per 10 g protein
411kcal
160kcal
N/A
Weight per 100 calories
32g
167g
N/A
Unsaturated / Saturated Fat ratio
1.7
14
N/A
Net carbs
48.67g
1.83g
N/A
Sugar
0.92g
N/A
Starch
0.64g
0%
Trans fat
0g
0.009g
N/A
Tryptophan
0.009mg
0%
Threonine
0.167mg
0%
Isoleucine
0.146mg
0%
Leucine
0.292mg
0%
Lysine
0.264mg
0%
Methionine
0.076mg
0%
Phenylalanine
0.161mg
0%
Valine
0.189mg
0%
Histidine
0.119mg
0%
Fructose
0.23g
0%
Omega-3 - ALA
0.373g
N/A
Omega-3 - Eicosatrienoic acid
0.018g
N/A
Omega-6 - Eicosadienoic acid
0.01g
N/A
Omega-6 - Linoleic acid
0.358g
N/A
Macronutrient Comparison
Macronutrient breakdown side-by-side comparison
4
8%
8%
75%
5%
4%
Protein:
7.61 g
Fats:
8.36 g
Carbs:
74.97 g
Water:
5.44 g
Other:
3.62 g
1
4%
3%
6%
84%
3%
Protein:
3.74 g
Fats:
3.34 g
Carbs:
5.83 g
Water:
83.72 g
Other:
3.37 g
Contains
more
Protein Protein
+103.5%
Contains
more
Fats Fats
+150.3%
Contains
more
Carbs Carbs
+1185.9%
Contains
more
Water Water
+1439%
Fat Type Comparison
Fat type breakdown side-by-side comparison
1
37%
26%
37%
Saturated fat:
Sat. Fat
2.28 g
Monounsaturated fat:
Mono. Fat
1.64 g
Polyunsaturated fat:
Poly. Fat
2.29 g
2
7%
69%
24%
Saturated fat:
Sat. Fat
0.214 g
Monounsaturated fat:
Mono. Fat
2.182 g
Polyunsaturated fat:
Poly. Fat
0.774 g
Contains
more
Poly. Fat Polyunsaturated fat
+195.9%
Contains
less
Sat. Fat Saturated fat
-90.6%
Contains
more
Mono. Fat Monounsaturated fat
+33%