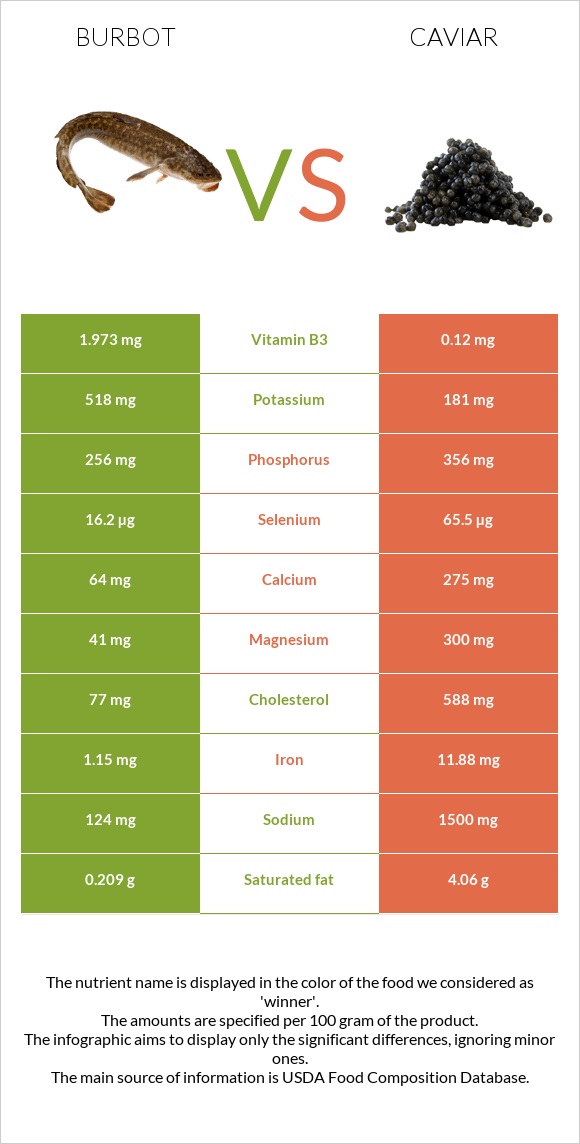
Important differences between burbot and caviar Burbot has more manganese; however, caviar is richer in vitamin B12, iron, selenium, vitamin B5, magnesium, vitamin B2, and calcium. Caviar's daily need coverage for vitamin B12 is 795% more. Burbot contains 18 times more manganese than caviar. Burbot contains 0.897mg of manganese, while caviar contains 0.05mg. Burbot contains less cholesterol. The food varieties used in the comparison are Fish, burbot, cooked, dry heat and Fish, caviar, black, and red, granular .
Infographic
Mineral Comparison
Mineral comparison score is based on the number of minerals by which one or the other food is richer. The "coverage" charts below show how much of the daily needs can be covered by 300 grams of the food.
4
100 g
300 g
3 oz - 85g 1 fillet - 90g
Magnesium
Magnesium
Calcium
Calcium
Potassium
Potassium
Iron
Iron
Copper
Copper
Zinc
Zinc
Phosphorus
Phosphorus
Sodium
Sodium
Manganese
Manganese
Selenium
Selenium
29%
19%
46%
43%
85%
26%
110%
16%
117%
88%
5
100 g
300 g
1 tbsp - 16g 1 oz - 28.35g
Magnesium
Magnesium
Calcium
Calcium
Potassium
Potassium
Iron
Iron
Copper
Copper
Zinc
Zinc
Phosphorus
Phosphorus
Sodium
Sodium
Manganese
Manganese
Selenium
Selenium
214%
83%
16%
446%
37%
26%
153%
196%
6.5%
357%
Vitamin Comparison
Vitamin comparison score is based on the number of vitamins by which one or the other food is richer. The "coverage" charts below show how much of the daily needs can be covered by 300 grams of the food.
2
100 g
300 g
3 oz - 85g 1 fillet - 90g
Vitamin C
Vit. C
Vitamin D
Vit. D
Vitamin A
Vit. A
Vitamin E
Vit. E
Vitamin B1
Vit. B1
Vitamin B2
Vit. B2
Vitamin B3
Vit. B3
Vitamin B5
Vit. B5
Vitamin B6
Vit. B6
Vitamin B12
Vit. B12
Vitamin K
Vit. K
Folate
Folate
0%
0%
1.7%
0%
107%
40%
37%
10%
80%
115%
0%
0.75%
8
100 g
300 g
1 tbsp - 16g 1 oz - 28.35g
Vitamin C
Vit. C
Vitamin D
Vit. D
Vitamin A
Vit. A
Vitamin E
Vit. E
Vitamin B1
Vit. B1
Vitamin B2
Vit. B2
Vitamin B3
Vit. B3
Vitamin B5
Vit. B5
Vitamin B6
Vit. B6
Vitamin B12
Vit. B12
Vitamin K
Vit. K
Folate
Folate
0%
44%
90%
38%
48%
143%
2.3%
210%
74%
2500%
1.5%
38%
All nutrients comparison - raw data values
Nutrient
DV% diff.
Vitamin B12
0.92µg
20µg
795%
Cholesterol
77mg
588mg
170%
Iron
1.15mg
11.88mg
134%
Selenium
16.2µg
65.5µg
90%
Choline
490.9mg
89%
Vitamin B5
0.173mg
3.5mg
67%
Magnesium
41mg
300mg
62%
Sodium
124mg
1500mg
60%
Polyunsaturated fat
0.381g
7.405g
47%
Manganese
0.897mg
0.05mg
37%
Vitamin B2
0.172mg
0.62mg
34%
Vitamin A
5µg
271µg
30%
Fats
1.04g
17.9g
26%
Calcium
64mg
275mg
21%
Vitamin B1
0.429mg
0.19mg
20%
Saturated fat
0.209g
4.06g
18%
Copper
0.256mg
0.11mg
16%
Vitamin D*
117 IU
15%
Vitamin D
2.9µg
15%
Phosphorus
256mg
356mg
14%
Vitamin E
1.89mg
13%
Vitamin B3
1.973mg
0.12mg
12%
Folate
1µg
50µg
12%
Monounsaturated fat
0.17g
4.631g
11%
Potassium
518mg
181mg
10%
Calories
115kcal
264kcal
7%
Vitamin B6
0.346mg
0.32mg
2%
Carbs
0g
4g
1%
Vitamin K
0.6µg
1%
Protein
24.76g
24.6g
0%
Protein per 100 calories
22g
9.3g
N/A
Calories per 10 g protein
46kcal
107kcal
N/A
Weight per 100 calories
87g
38g
N/A
Unsaturated / Saturated Fat ratio
2.6
3
N/A
Net carbs
0g
4g
N/A
Zinc
0.97mg
0.95mg
0%
Tryptophan
0.277mg
0.323mg
0%
Threonine
1.085mg
1.263mg
0%
Isoleucine
1.141mg
1.035mg
0%
Leucine
2.012mg
2.133mg
0%
Lysine
2.274mg
1.834mg
0%
Methionine
0.733mg
0.646mg
0%
Phenylalanine
0.966mg
1.071mg
0%
Valine
1.275mg
1.263mg
0%
Histidine
0.729mg
0.649mg
0%
Omega-3 - EPA
0.09g
2.741g
N/A
Omega-3 - DHA
0.123g
3.8g
N/A
Omega-3 - DPA
0.033g
0.229g
N/A
Macronutrient Comparison
Macronutrient breakdown side-by-side comparison
2
25%
73%
Protein:
24.76 g
Fats:
1.04 g
Carbs:
0 g
Water:
73.41 g
Other:
0.79 g
3
25%
18%
4%
48%
6%
Protein:
24.6 g
Fats:
17.9 g
Carbs:
4 g
Water:
47.5 g
Other:
6 g
Contains
more
Water Water
+54.5%
Contains
more
Fats Fats
+1621.2%
Contains
more
Carbs Carbs
+∞%
Contains
more
Other Other
+659.5%
Fat Type Comparison
Fat type breakdown side-by-side comparison
1
28%
22%
50%
Saturated fat:
Sat. Fat
0.209 g
Monounsaturated fat:
Mono. Fat
0.17 g
Polyunsaturated fat:
Poly. Fat
0.381 g
2
25%
29%
46%
Saturated fat:
Sat. Fat
4.06 g
Monounsaturated fat:
Mono. Fat
4.631 g
Polyunsaturated fat:
Poly. Fat
7.405 g
Contains
less
Sat. Fat Saturated fat
-94.9%
Contains
more
Mono. Fat Monounsaturated fat
+2624.1%
Contains
more
Poly. Fat Polyunsaturated fat
+1843.6%