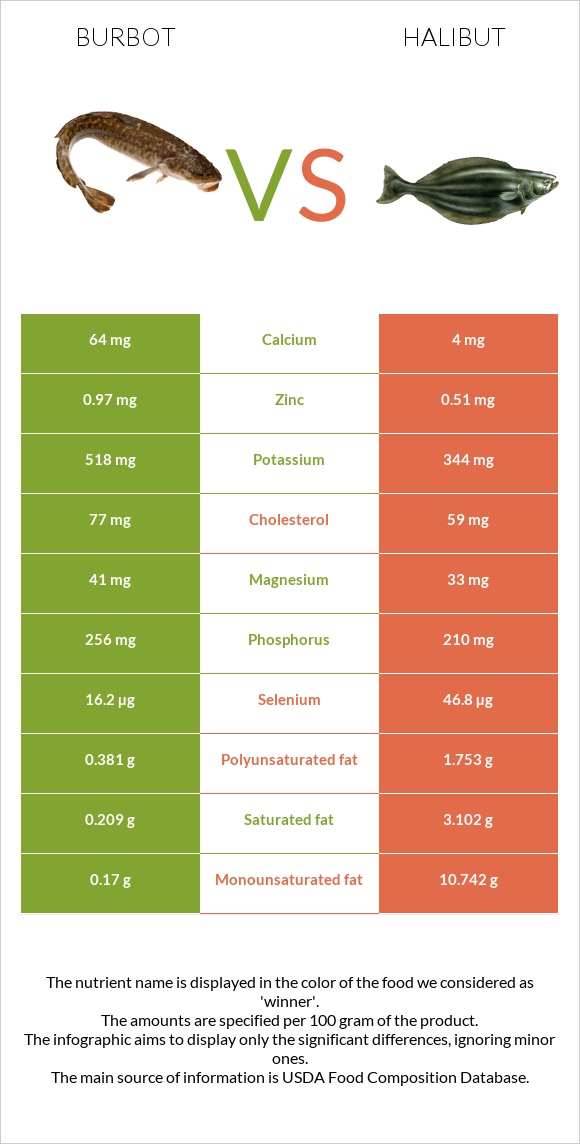
What are the main differences between burbot and halibut? Burbot is richer in manganese, vitamin B1, copper, phosphorus, calcium, and vitamin B2, yet halibut is richer in selenium and vitamin B6. Halibut's daily need coverage for selenium is 56% higher. Burbot has 60 times more manganese than halibut. Burbot has 0.897mg of manganese, while halibut has 0.015mg. Halibut contains less cholesterol. We used Fish, burbot, cooked, dry heat and Fish, halibut, greenland, cooked, dry heat types in this comparison.
Infographic
Mineral Comparison
Mineral comparison score is based on the number of minerals by which one or the other food is richer. The "coverage" charts below show how much of the daily needs can be covered by 300 grams of the food.
8
100 g
300 g
3 oz - 85g 1 fillet - 90g
Magnesium
Magnesium
Calcium
Calcium
Potassium
Potassium
Iron
Iron
Copper
Copper
Zinc
Zinc
Phosphorus
Phosphorus
Sodium
Sodium
Manganese
Manganese
Selenium
Selenium
29%
19%
46%
43%
85%
26%
110%
16%
117%
88%
2
100 g
300 g
3 oz - 85g 0.5 fillet - 159g
Magnesium
Magnesium
Calcium
Calcium
Potassium
Potassium
Iron
Iron
Copper
Copper
Zinc
Zinc
Phosphorus
Phosphorus
Sodium
Sodium
Manganese
Manganese
Selenium
Selenium
24%
1.2%
30%
32%
13%
14%
90%
13%
2%
255%
Vitamin Comparison
Vitamin comparison score is based on the number of vitamins by which one or the other food is richer. The "coverage" charts below show how much of the daily needs can be covered by 300 grams of the food.
2
100 g
300 g
3 oz - 85g 1 fillet - 90g
Vitamin C
Vit. C
Vitamin D
Vit. D
Vitamin A
Vit. A
Vitamin E
Vit. E
Vitamin B1
Vit. B1
Vitamin B2
Vit. B2
Vitamin B3
Vit. B3
Vitamin B5
Vit. B5
Vitamin B6
Vit. B6
Vitamin B12
Vit. B12
Vitamin K
Vit. K
Folate
Folate
0%
0%
1.7%
0%
107%
40%
37%
10%
80%
115%
0%
0.75%
3
100 g
300 g
3 oz - 85g 0.5 fillet - 159g
Vitamin C
Vit. C
Vitamin D
Vit. D
Vitamin A
Vit. A
Vitamin E
Vit. E
Vitamin B1
Vit. B1
Vitamin B2
Vit. B2
Vitamin B3
Vit. B3
Vitamin B5
Vit. B5
Vitamin B6
Vit. B6
Vitamin B12
Vit. B12
Vitamin K
Vit. K
Folate
Folate
0%
0%
6%
0%
18%
24%
36%
17%
112%
120%
0%
0.75%
All nutrients comparison - raw data values
Nutrient
DV% diff.
Selenium
16.2µg
46.8µg
56%
Manganese
0.897mg
0.015mg
38%
Vitamin B1
0.429mg
0.073mg
30%
Fats
1.04g
17.74g
26%
Monounsaturated fat
0.17g
10.742g
26%
Copper
0.256mg
0.038mg
24%
Protein
24.76g
18.42g
13%
Saturated fat
0.209g
3.102g
13%
Vitamin B6
0.346mg
0.485mg
11%
Polyunsaturated fat
0.381g
1.753g
9%
Phosphorus
256mg
210mg
7%
Calories
115kcal
239kcal
6%
Cholesterol
77mg
59mg
6%
Calcium
64mg
4mg
6%
Potassium
518mg
344mg
5%
Vitamin B2
0.172mg
0.103mg
5%
Iron
1.15mg
0.85mg
4%
Zinc
0.97mg
0.51mg
4%
Magnesium
41mg
33mg
2%
Vitamin B5
0.173mg
0.288mg
2%
Vitamin B12
0.92µg
0.96µg
2%
Sodium
124mg
103mg
1%
Vitamin A
5µg
18µg
1%
Protein per 100 calories
22g
7.7g
N/A
Calories per 10 g protein
46kcal
130kcal
N/A
Weight per 100 calories
87g
42g
N/A
Unsaturated / Saturated Fat ratio
2.6
4
N/A
Vitamin B3
1.973mg
1.923mg
0%
Folate
1µg
1µg
0%
Tryptophan
0.277mg
0.206mg
0%
Threonine
1.085mg
0.808mg
0%
Isoleucine
1.141mg
0.849mg
0%
Leucine
2.012mg
1.497mg
0%
Lysine
2.274mg
1.692mg
0%
Methionine
0.733mg
0.545mg
0%
Phenylalanine
0.966mg
0.719mg
0%
Valine
1.275mg
0.949mg
0%
Histidine
0.729mg
0.542mg
0%
Omega-3 - EPA
0.09g
0.674g
N/A
Omega-3 - DHA
0.123g
0.504g
N/A
Omega-3 - DPA
0.033g
0.114g
N/A
Macronutrient Comparison
Macronutrient breakdown side-by-side comparison
2
25%
73%
Protein:
24.76 g
Fats:
1.04 g
Carbs:
0 g
Water:
73.41 g
Other:
0.79 g
2
18%
18%
62%
2%
Protein:
18.42 g
Fats:
17.74 g
Carbs:
0 g
Water:
61.88 g
Other:
1.96 g
Contains
more
Protein Protein
+34.4%
Contains
more
Water Water
+18.6%
Contains
more
Fats Fats
+1605.8%
Contains
more
Other Other
+148.1%
Fat Type Comparison
Fat type breakdown side-by-side comparison
1
28%
22%
50%
Saturated fat:
Sat. Fat
0.209 g
Monounsaturated fat:
Mono. Fat
0.17 g
Polyunsaturated fat:
Poly. Fat
0.381 g
2
20%
69%
11%
Saturated fat:
Sat. Fat
3.102 g
Monounsaturated fat:
Mono. Fat
10.742 g
Polyunsaturated fat:
Poly. Fat
1.753 g
Contains
less
Sat. Fat Saturated fat
-93.3%
Contains
more
Mono. Fat Monounsaturated fat
+6218.8%
Contains
more
Poly. Fat Polyunsaturated fat
+360.1%