Caesar salad vs. Salisbury steak — In-Depth Nutrition Comparison
Compare
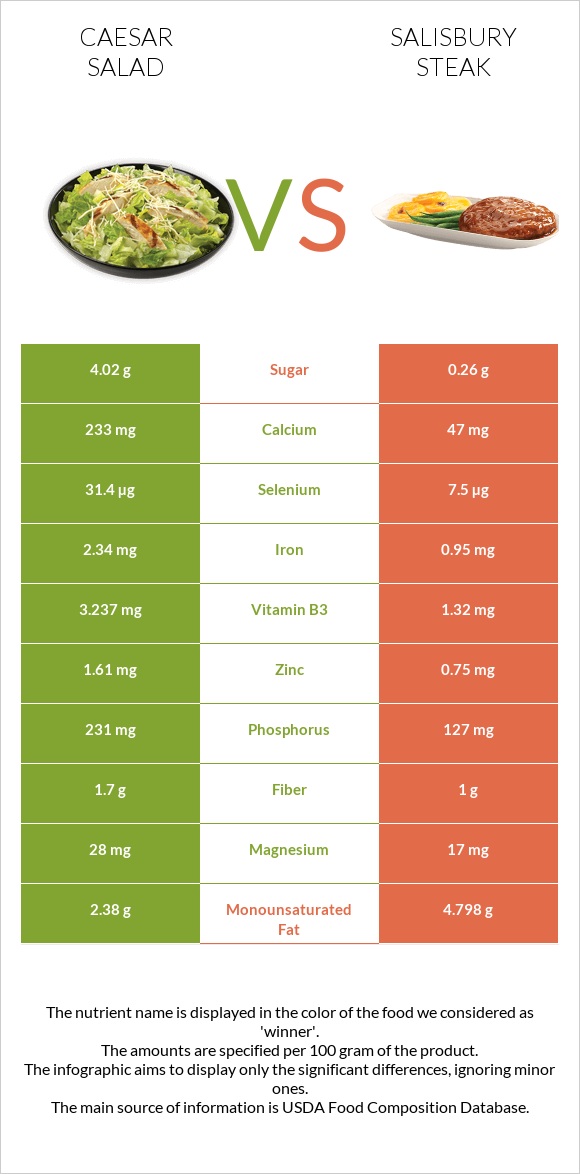
How are caesar salad and salisbury steak different?
- Caesar salad is higher than salisbury steak in selenium, vitamin B1, calcium, iron, phosphorus, vitamin B2, vitamin B3, zinc, vitamin A, and manganese.
- Caesar salad covers your daily need for selenium, 43% more than salisbury steak.
- Caesar salad contains 72 times more vitamin A than salisbury steak. Caesar salad contains 360 IU of vitamin A, while salisbury steak contains 5 IU.
LITTLE CAESARS 14" Original Round Cheese Pizza, Regular Crust and Salisbury steak with gravy, frozen types were used in this article.
Infographic
Infographic link
Mineral Comparison
Mineral comparison score is based on the number of minerals by which one or the other food is richer. The "coverage" charts below show how much of the daily needs can be covered by 300 grams of the food.
| Contains more MagnesiumMagnesium | +64.7% |
| Contains more CalciumCalcium | +395.7% |
| Contains more PotassiumPotassium | +18.1% |
| Contains more IronIron | +146.3% |
| Contains more CopperCopper | +51.8% |
| Contains more ZincZinc | +114.7% |
| Contains more PhosphorusPhosphorus | +81.9% |
| Contains less SodiumSodium | -10.8% |
| Contains more ManganeseManganese | +84.5% |
| Contains more SeleniumSelenium | +318.7% |
Vitamin Comparison
Vitamin comparison score is based on the number of vitamins by which one or the other food is richer. The "coverage" charts below show how much of the daily needs can be covered by 300 grams of the food.
| Contains more Vitamin AVitamin A | +3800% |
| Contains more Vitamin EVitamin E | +165.2% |
| Contains more Vitamin B1Vitamin B1 | +539% |
| Contains more Vitamin B2Vitamin B2 | +151.7% |
| Contains more Vitamin B3Vitamin B3 | +145.2% |
| Contains more Vitamin B5Vitamin B5 | +120.2% |
| Contains more Vitamin KVitamin K | +247.1% |
All nutrients comparison - raw data values
| Nutrient |  |
 |
DV% diff. |
| Selenium | 31.4µg | 7.5µg | 43% |
| Vitamin B1 | 0.377mg | 0.059mg | 27% |
| Calcium | 233mg | 47mg | 19% |
| Iron | 2.34mg | 0.95mg | 17% |
| Phosphorus | 231mg | 127mg | 15% |
| Vitamin B2 | 0.297mg | 0.118mg | 14% |
| Protein | 13.39g | 6.98g | 13% |
| Vitamin B3 | 3.237mg | 1.32mg | 12% |
| Vitamin B6 | 0.131mg | 10% | |
| Starch | 25.29g | 2.53g | 9% |
| Choline | 46.8mg | 9% | |
| Carbs | 31.5g | 6.78g | 8% |
| Zinc | 1.61mg | 0.75mg | 8% |
| Vitamin A | 78µg | 2µg | 8% |
| Calories | 265kcal | 149kcal | 6% |
| Manganese | 0.321mg | 0.174mg | 6% |
| Monounsaturated fat | 2.38g | 4.798g | 6% |
| Copper | 0.126mg | 0.083mg | 5% |
| Vitamin B5 | 0.447mg | 0.203mg | 5% |
| Vitamin K | 5.9µg | 1.7µg | 4% |
| Cholesterol | 24mg | 33mg | 3% |
| Magnesium | 28mg | 17mg | 3% |
| Fiber | 1.7g | 1g | 3% |
| Vitamin E | 0.61mg | 0.23mg | 3% |
| Folate | 13µg | 3% | |
| Sodium | 454mg | 509mg | 2% |
| Fats | 9.54g | 10.47g | 1% |
| Potassium | 170mg | 144mg | 1% |
| Saturated fat | 4.206g | 3.982g | 1% |
| Fructose | 1.13g | 0g | 1% |
| Net carbs | 29.8g | 5.78g | N/A |
| Vitamin D | 0 IU | 1 IU | 0% |
| Sugar | 4.02g | 0.26g | N/A |
| Vitamin B12 | 0.4µg | 0.41µg | 0% |
| Trans fat | 0.284g | N/A | |
| Polyunsaturated fat | 1.461g | 1.483g | 0% |
| Tryptophan | 0.15mg | 0% | |
| Threonine | 0.393mg | 0% | |
| Isoleucine | 0.547mg | 0% | |
| Leucine | 1.137mg | 0% | |
| Lysine | 0.523mg | 0% | |
| Methionine | 0.3mg | 0% | |
| Phenylalanine | 0.717mg | 0% | |
| Valine | 0.7mg | 0% | |
| Histidine | 0.36mg | 0% | |
| Omega-3 - EPA | 0.003g | N/A | |
| Omega-3 - DHA | 0.002g | N/A | |
| Omega-3 - ALA | 0.155g | 0.057g | N/A |
| Omega-3 - DPA | 0.004g | N/A | |
| Omega-3 - Eicosatrienoic acid | 0.004g | N/A | |
| Omega-6 - Gamma-linoleic acid | 0g | 0.002g | N/A |
| Omega-6 - Dihomo-gamma-linoleic acid | 0.012g | N/A | |
| Omega-6 - Eicosadienoic acid | 0g | 0.03g | N/A |
| Omega-6 - Linoleic acid | 1.252g | N/A |
Macronutrient Comparison
Macronutrient breakdown side-by-side comparison
Protein:
13.39 g
Fats:
9.54 g
Carbs:
31.5 g
Water:
43.39 g
Other:
2.18 g
Protein:
6.98 g
Fats:
10.47 g
Carbs:
6.78 g
Water:
74.19 g
Other:
1.58 g
| Contains more ProteinProtein | +91.8% |
| Contains more CarbsCarbs | +364.6% |
| Contains more OtherOther | +38% |
| Contains more WaterWater | +71% |
~equal in
Fats
~10.47g
Fat Type Comparison
Fat type breakdown side-by-side comparison
Saturated fat:
Sat. Fat
4.206 g
Monounsaturated fat:
Mono. Fat
2.38 g
Polyunsaturated fat:
Poly. Fat
1.461 g
Saturated fat:
Sat. Fat
3.982 g
Monounsaturated fat:
Mono. Fat
4.798 g
Polyunsaturated fat:
Poly. Fat
1.483 g
| Contains more Mono. FatMonounsaturated fat | +101.6% |
~equal in
Saturated fat
~3.982g
~equal in
Polyunsaturated fat
~1.483g
Carbohydrate type comparison
Carbohydrate type breakdown side-by-side comparison
Starch:
25.29 g
Sucrose:
0 g
Glucose:
0.98 g
Fructose:
1.13 g
Lactose:
0.07 g
Maltose:
1.67 g
Galactose:
0.16 g
Starch:
2.53 g
Sucrose:
0 g
Glucose:
0.26 g
Fructose:
0 g
Lactose:
0 g
Maltose:
0 g
Galactose:
0 g
| Contains more StarchStarch | +899.6% |
| Contains more GlucoseGlucose | +276.9% |
| Contains more FructoseFructose | +∞% |
| Contains more LactoseLactose | +∞% |
| Contains more MaltoseMaltose | +∞% |
| Contains more GalactoseGalactose | +∞% |
~equal in
Sucrose
~0g


