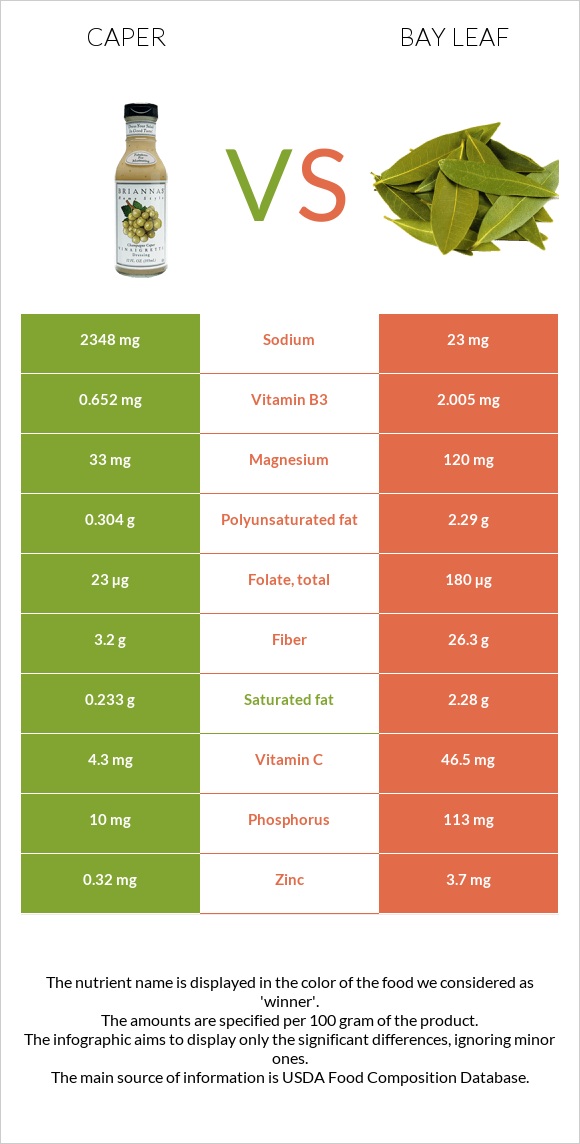
How are caper and bay leaf different? Bay leaf is higher than caper in iron, manganese, vitamin B6, vitamin A, fiber, calcium, vitamin C, folate, and zinc. Bay leaf covers your daily need for iron, 517% more than caper. Caper contains 102 times more sodium than bay leaf. Caper contains 2348mg of sodium, while bay leaf contains 23mg. Capers, canned and Spices, bay leaf types were used in this article.
Infographic
Mineral Comparison
Mineral comparison score is based on the number of minerals by which one or the other food is richer. The "coverage" charts below show how much of the daily needs can be covered by 300 grams of the food.
0
100 g
300 g
1 tbsp, drained - 8.6g
Magnesium
Magnesium
Calcium
Calcium
Potassium
Potassium
Iron
Iron
Copper
Copper
Zinc
Zinc
Phosphorus
Phosphorus
Sodium
Sodium
Manganese
Manganese
Selenium
Selenium
24%
12%
3.5%
63%
125%
8.7%
4.3%
306%
10%
6.5%
10
100 g
300 g
1 tsp, crumbled - 0.6g 1 tbsp, crumbled - 1.8g
Magnesium
Magnesium
Calcium
Calcium
Potassium
Potassium
Iron
Iron
Copper
Copper
Zinc
Zinc
Phosphorus
Phosphorus
Sodium
Sodium
Manganese
Manganese
Selenium
Selenium
86%
250%
47%
1613%
139%
101%
48%
3%
1065%
15%
Vitamin Comparison
Vitamin comparison score is based on the number of vitamins by which one or the other food is richer. The "coverage" charts below show how much of the daily needs can be covered by 300 grams of the food.
4
100 g
300 g
1 tbsp, drained - 8.6g
Vitamin C
Vit. C
Vitamin D
Vit. D
Vitamin A
Vit. A
Vitamin E
Vit. E
Vitamin B1
Vit. B1
Vitamin B2
Vit. B2
Vitamin B3
Vit. B3
Vitamin B5
Vit. B5
Vitamin B6
Vit. B6
Vitamin B12
Vit. B12
Vitamin K
Vit. K
Folate
Folate
14%
0%
2.3%
18%
4.5%
32%
12%
1.6%
5.3%
0%
62%
17%
6
100 g
300 g
1 tsp, crumbled - 0.6g 1 tbsp, crumbled - 1.8g
Vitamin C
Vit. C
Vitamin D
Vit. D
Vitamin A
Vit. A
Vitamin E
Vit. E
Vitamin B1
Vit. B1
Vitamin B2
Vit. B2
Vitamin B3
Vit. B3
Vitamin B5
Vit. B5
Vitamin B6
Vit. B6
Vitamin B12
Vit. B12
Vitamin K
Vit. K
Folate
Folate
155%
0%
103%
0%
2.3%
97%
38%
0%
402%
0%
0%
135%
All nutrients comparison - raw data values
Nutrient
DV% diff.
Iron
1.67mg
43mg
517%
Manganese
0.078mg
8.167mg
352%
Vitamin B6
0.023mg
1.74mg
132%
Sodium
2348mg
23mg
101%
Fiber
3.2g
26.3g
92%
Calcium
40mg
834mg
79%
Vitamin C
4.3mg
46.5mg
47%
Folate
23µg
180µg
39%
Vitamin A
7µg
309µg
34%
Zinc
0.32mg
3.7mg
31%
Carbs
4.89g
74.97g
23%
Vitamin B2
0.139mg
0.421mg
22%
Magnesium
33mg
120mg
21%
Vitamin K
24.6µg
21%
Calories
23kcal
313kcal
15%
Phosphorus
10mg
113mg
15%
Potassium
40mg
529mg
14%
Polyunsaturated fat
0.304g
2.29g
13%
Fats
0.86g
8.36g
12%
Protein
2.36g
7.61g
11%
Saturated fat
0.233g
2.28g
9%
Vitamin B3
0.652mg
2.005mg
8%
Vitamin E
0.88mg
6%
Copper
0.374mg
0.416mg
5%
Monounsaturated fat
0.063g
1.64g
4%
Selenium
1.2µg
2.8µg
3%
Vitamin B1
0.018mg
0.009mg
1%
Vitamin B5
0.027mg
1%
Choline
6.5mg
1%
Protein per 100 calories
10g
2.4g
N/A
Calories per 10 g protein
97kcal
411kcal
N/A
Weight per 100 calories
435g
32g
N/A
Unsaturated / Saturated Fat ratio
1.6
1.7
N/A
Net carbs
1.69g
48.67g
N/A
Sugar
0.41g
N/A
Omega-3 - DPA
0.001g
0g
N/A
Macronutrient Comparison
Macronutrient breakdown side-by-side comparison
2
2%
5%
84%
8%
Protein:
2.36 g
Fats:
0.86 g
Carbs:
4.89 g
Water:
83.85 g
Other:
8.04 g
3
8%
8%
75%
5%
4%
Protein:
7.61 g
Fats:
8.36 g
Carbs:
74.97 g
Water:
5.44 g
Other:
3.62 g
Contains
more
Water Water
+1441.4%
Contains
more
Other Other
+122.1%
Contains
more
Protein Protein
+222.5%
Contains
more
Fats Fats
+872.1%
Contains
more
Carbs Carbs
+1433.1%
Fat Type Comparison
Fat type breakdown side-by-side comparison
1
39%
11%
51%
Saturated fat:
Sat. Fat
0.233 g
Monounsaturated fat:
Mono. Fat
0.063 g
Polyunsaturated fat:
Poly. Fat
0.304 g
2
37%
26%
37%
Saturated fat:
Sat. Fat
2.28 g
Monounsaturated fat:
Mono. Fat
1.64 g
Polyunsaturated fat:
Poly. Fat
2.29 g
Contains
less
Sat. Fat Saturated fat
-89.8%
Contains
more
Mono. Fat Monounsaturated fat
+2503.2%
Contains
more
Poly. Fat Polyunsaturated fat
+653.3%