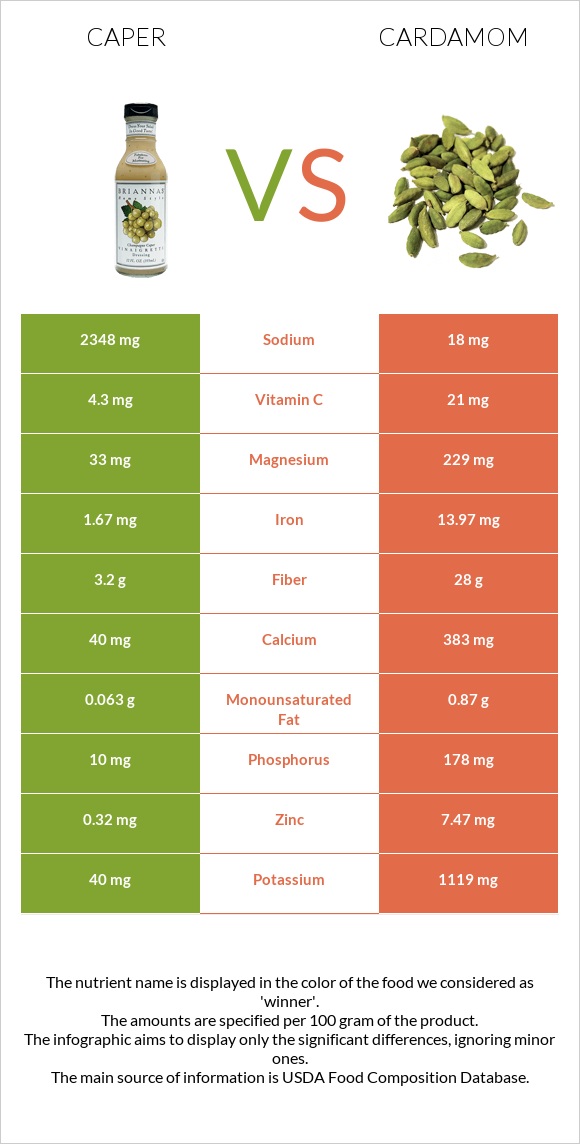
Significant differences between caper and cardamom The amount of manganese, iron, fiber, zinc, magnesium, calcium, potassium, phosphorus, and vitamin C in cardamom is higher than in caper. Cardamom covers your daily manganese needs 1214% more than caper. Cardamom has 130 times less sodium than caper. Caper has 2348mg of sodium, while cardamom has 18mg. Specific food types used in this comparison are Capers, canned and Spices, cardamom .
Infographic
Mineral Comparison
Mineral comparison score is based on the number of minerals by which one or the other food is richer. The "coverage" charts below show how much of the daily needs can be covered by 300 grams of the food.
1
100 g
300 g
1 tbsp, drained - 8.6g
Magnesium
Magnesium
Calcium
Calcium
Potassium
Potassium
Iron
Iron
Copper
Copper
Zinc
Zinc
Phosphorus
Phosphorus
Sodium
Sodium
Manganese
Manganese
Selenium
Selenium
24%
12%
3.5%
63%
125%
8.7%
4.3%
306%
10%
6.5%
8
100 g
300 g
1 tsp, ground - 2g 1 tbsp, ground - 5.8g
Magnesium
Magnesium
Calcium
Calcium
Potassium
Potassium
Iron
Iron
Copper
Copper
Zinc
Zinc
Phosphorus
Phosphorus
Sodium
Sodium
Manganese
Manganese
Selenium
Selenium
164%
115%
99%
524%
128%
204%
76%
2.3%
3652%
0%
Vitamin Comparison
Vitamin comparison score is based on the number of vitamins by which one or the other food is richer. The "coverage" charts below show how much of the daily needs can be covered by 300 grams of the food.
5
100 g
300 g
1 tbsp, drained - 8.6g
Vitamin C
Vit. C
Vitamin D
Vit. D
Vitamin A
Vit. A
Vitamin E
Vit. E
Vitamin B1
Vit. B1
Vitamin B2
Vit. B2
Vitamin B3
Vit. B3
Vitamin B5
Vit. B5
Vitamin B6
Vit. B6
Vitamin B12
Vit. B12
Vitamin K
Vit. K
Folate
Folate
14%
0%
2.3%
18%
4.5%
32%
12%
1.6%
5.3%
0%
62%
17%
5
100 g
300 g
1 tsp, ground - 2g 1 tbsp, ground - 5.8g
Vitamin C
Vit. C
Vitamin D
Vit. D
Vitamin A
Vit. A
Vitamin E
Vit. E
Vitamin B1
Vit. B1
Vitamin B2
Vit. B2
Vitamin B3
Vit. B3
Vitamin B5
Vit. B5
Vitamin B6
Vit. B6
Vitamin B12
Vit. B12
Vitamin K
Vit. K
Folate
Folate
70%
0%
0%
0%
50%
42%
21%
0%
53%
0%
0%
0%
All nutrients comparison - raw data values
Nutrient
DV% diff.
Manganese
0.078mg
28mg
1214%
Iron
1.67mg
13.97mg
154%
Sodium
2348mg
18mg
101%
Fiber
3.2g
28g
99%
Zinc
0.32mg
7.47mg
65%
Magnesium
33mg
229mg
47%
Calcium
40mg
383mg
34%
Potassium
40mg
1119mg
32%
Phosphorus
10mg
178mg
24%
Carbs
4.89g
68.47g
21%
Vitamin K
24.6µg
21%
Vitamin C
4.3mg
21mg
19%
Protein
2.36g
10.76g
17%
Vitamin B6
0.023mg
0.23mg
16%
Vitamin B1
0.018mg
0.198mg
15%
Calories
23kcal
311kcal
14%
Fats
0.86g
6.7g
9%
Vitamin E
0.88mg
6%
Folate
23µg
6%
Vitamin B2
0.139mg
0.182mg
3%
Vitamin B3
0.652mg
1.102mg
3%
Selenium
1.2µg
2%
Saturated fat
0.233g
0.68g
2%
Monounsaturated fat
0.063g
0.87g
2%
Copper
0.374mg
0.383mg
1%
Vitamin A
7µg
0µg
1%
Vitamin B5
0.027mg
1%
Choline
6.5mg
1%
Polyunsaturated fat
0.304g
0.43g
1%
Protein per 100 calories
10g
3.5g
N/A
Calories per 10 g protein
97kcal
289kcal
N/A
Weight per 100 calories
435g
32g
N/A
Unsaturated / Saturated Fat ratio
1.6
1.9
N/A
Net carbs
1.69g
40.47g
N/A
Sugar
0.41g
N/A
Omega-3 - DPA
0.001g
N/A
Macronutrient Comparison
Macronutrient breakdown side-by-side comparison
2
2%
5%
84%
8%
Protein:
2.36 g
Fats:
0.86 g
Carbs:
4.89 g
Water:
83.85 g
Other:
8.04 g
3
11%
7%
68%
8%
6%
Protein:
10.76 g
Fats:
6.7 g
Carbs:
68.47 g
Water:
8.28 g
Other:
5.79 g
Contains
more
Water Water
+912.7%
Contains
more
Other Other
+38.9%
Contains
more
Protein Protein
+355.9%
Contains
more
Fats Fats
+679.1%
Contains
more
Carbs Carbs
+1300.2%
Fat Type Comparison
Fat type breakdown side-by-side comparison
1
39%
11%
51%
Saturated fat:
Sat. Fat
0.233 g
Monounsaturated fat:
Mono. Fat
0.063 g
Polyunsaturated fat:
Poly. Fat
0.304 g
2
34%
44%
22%
Saturated fat:
Sat. Fat
0.68 g
Monounsaturated fat:
Mono. Fat
0.87 g
Polyunsaturated fat:
Poly. Fat
0.43 g
Contains
less
Sat. Fat Saturated fat
-65.7%
Contains
more
Mono. Fat Monounsaturated fat
+1281%
Contains
more
Poly. Fat Polyunsaturated fat
+41.4%