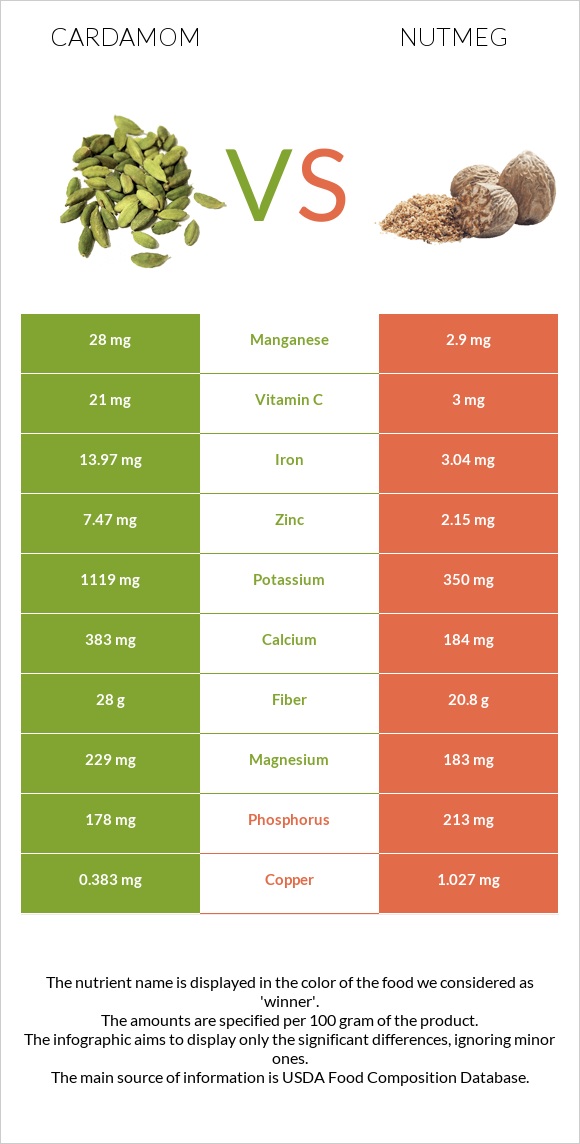
Differences between cardamom and nutmeg Cardamom has more manganese, iron, zinc, fiber, potassium, vitamin C, and calcium, while nutmeg has more copper and vitamin B1. Cardamom's daily need coverage for manganese is 1091% higher. Nutmeg contains 7 times less vitamin C than cardamom. Cardamom contains 21mg of vitamin C, while nutmeg contains 3mg. The amount of saturated fat in cardamom is lower. The food types used in this comparison are Spices, cardamom and Spices, nutmeg, ground .
Infographic
Mineral Comparison
Mineral comparison score is based on the number of minerals by which one or the other food is richer. The "coverage" charts below show how much of the daily needs can be covered by 300 grams of the food.
6
100 g
300 g
1 tsp, ground - 2g 1 tbsp, ground - 5.8g
Magnesium
Magnesium
Calcium
Calcium
Potassium
Potassium
Iron
Iron
Copper
Copper
Zinc
Zinc
Phosphorus
Phosphorus
Sodium
Sodium
Manganese
Manganese
Selenium
Selenium
164%
115%
99%
524%
128%
204%
76%
2.3%
3652%
0%
4
100 g
300 g
0.25 tsp - 0.5g 1 tbsp - 7g
Magnesium
Magnesium
Calcium
Calcium
Potassium
Potassium
Iron
Iron
Copper
Copper
Zinc
Zinc
Phosphorus
Phosphorus
Sodium
Sodium
Manganese
Manganese
Selenium
Selenium
131%
55%
31%
114%
342%
59%
91%
2.1%
378%
8.7%
Vitamin Comparison
Vitamin comparison score is based on the number of vitamins by which one or the other food is richer. The "coverage" charts below show how much of the daily needs can be covered by 300 grams of the food.
3
100 g
300 g
1 tsp, ground - 2g 1 tbsp, ground - 5.8g
Vitamin C
Vit. C
Vitamin D
Vit. D
Vitamin A
Vit. A
Vitamin E
Vit. E
Vitamin B1
Vit. B1
Vitamin B2
Vit. B2
Vitamin B3
Vit. B3
Vitamin B5
Vit. B5
Vitamin B6
Vit. B6
Vitamin B12
Vit. B12
Vitamin K
Vit. K
Folate
Folate
70%
0%
0%
0%
50%
42%
21%
0%
53%
0%
0%
0%
4
100 g
300 g
0.25 tsp - 0.5g 1 tbsp - 7g
Vitamin C
Vit. C
Vitamin D
Vit. D
Vitamin A
Vit. A
Vitamin E
Vit. E
Vitamin B1
Vit. B1
Vitamin B2
Vit. B2
Vitamin B3
Vit. B3
Vitamin B5
Vit. B5
Vitamin B6
Vit. B6
Vitamin B12
Vit. B12
Vitamin K
Vit. K
Folate
Folate
10%
0%
1.7%
0%
87%
13%
24%
0%
37%
0%
0%
57%
All nutrients comparison - raw data values
Nutrient
DV% diff.
Manganese
28mg
2.9mg
1091%
Iron
13.97mg
3.04mg
137%
Saturated fat
0.68g
25.94g
115%
Copper
0.383mg
1.027mg
72%
Zinc
7.47mg
2.15mg
48%
Fats
6.7g
36.31g
46%
Fiber
28g
20.8g
29%
Potassium
1119mg
350mg
23%
Vitamin C
21mg
3mg
20%
Calcium
383mg
184mg
20%
Folate
76µg
19%
Vitamin B1
0.198mg
0.346mg
12%
Calories
311kcal
525kcal
11%
Magnesium
229mg
183mg
11%
Protein
10.76g
5.84g
10%
Vitamin B2
0.182mg
0.057mg
10%
Carbs
68.47g
49.29g
6%
Monounsaturated fat
0.87g
3.22g
6%
Phosphorus
178mg
213mg
5%
Vitamin B6
0.23mg
0.16mg
5%
Selenium
1.6µg
3%
Choline
8.8mg
2%
Vitamin A
0µg
5µg
1%
Vitamin B3
1.102mg
1.299mg
1%
Polyunsaturated fat
0.43g
0.35g
1%
Protein per 100 calories
3.5g
1.1g
N/A
Calories per 10 g protein
289kcal
899kcal
N/A
Weight per 100 calories
32g
19g
N/A
Unsaturated / Saturated Fat ratio
1.9
0.14
N/A
Net carbs
40.47g
28.49g
N/A
Sugar
2.99g
N/A
Sodium
18mg
16mg
0%
Macronutrient Comparison
Macronutrient breakdown side-by-side comparison
4
11%
7%
68%
8%
6%
Protein:
10.76 g
Fats:
6.7 g
Carbs:
68.47 g
Water:
8.28 g
Other:
5.79 g
1
6%
36%
49%
6%
2%
Protein:
5.84 g
Fats:
36.31 g
Carbs:
49.29 g
Water:
6.23 g
Other:
2.33 g
Contains
more
Protein Protein
+84.2%
Contains
more
Carbs Carbs
+38.9%
Contains
more
Water Water
+32.9%
Contains
more
Other Other
+148.5%
Contains
more
Fats Fats
+441.9%
Fat Type Comparison
Fat type breakdown side-by-side comparison
2
34%
44%
22%
Saturated fat:
Sat. Fat
0.68 g
Monounsaturated fat:
Mono. Fat
0.87 g
Polyunsaturated fat:
Poly. Fat
0.43 g
1
88%
11%
Saturated fat:
Sat. Fat
25.94 g
Monounsaturated fat:
Mono. Fat
3.22 g
Polyunsaturated fat:
Poly. Fat
0.35 g
Contains
less
Sat. Fat Saturated fat
-97.4%
Contains
more
Poly. Fat Polyunsaturated fat
+22.9%
Contains
more
Mono. Fat Monounsaturated fat
+270.1%