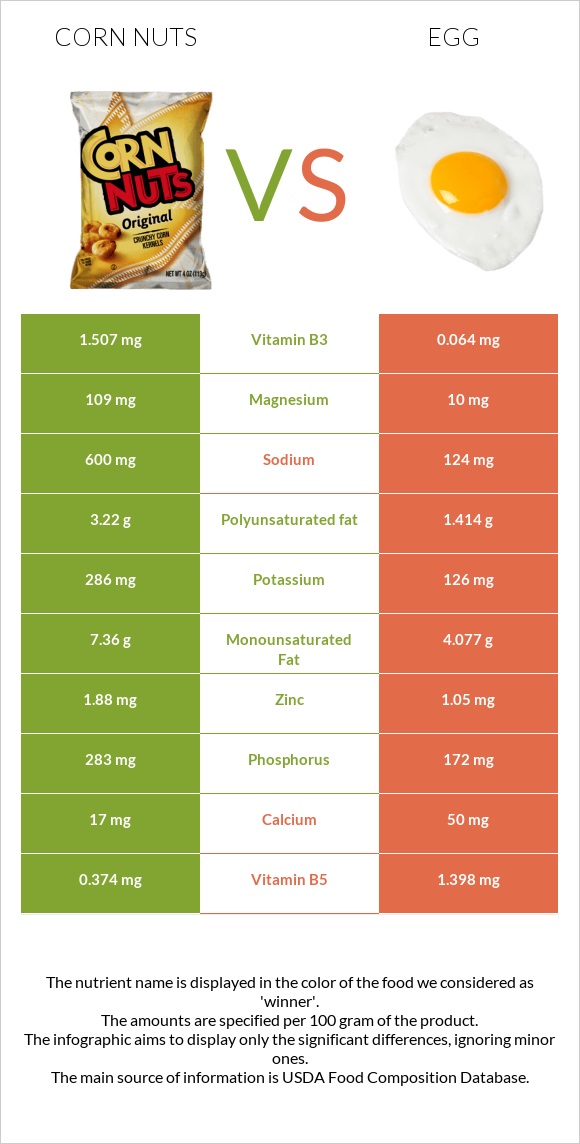
Significant differences between corn nuts and eggs Corn nuts have more fiber, vitamin B1, magnesium, and manganese; however, eggs are richer in copper, vitamin B12, vitamin B2, and vitamin B5. Eggs cover your daily copper needs 207% more than corn nuts. Eggs contain less sodium. Corn nuts have a higher glycemic index. The glycemic index of corn nuts is 40, while the glycemic index of eggs is 0. Specific food types used in this comparison are Snacks, cornnuts, barbecue-flavor and Egg, whole, cooked, hard-boiled .
Infographic
Mineral Comparison
Mineral comparison score is based on the number of minerals by which one or the other food is richer. The "coverage" charts below show how much of the daily needs can be covered by 300 grams of the food.
6
100 g
300 g
1 oz - 28.35g 2 oz - 57g
Magnesium
Magnesium
Calcium
Calcium
Potassium
Potassium
Iron
Iron
Copper
Copper
Zinc
Zinc
Phosphorus
Phosphorus
Sodium
Sodium
Manganese
Manganese
Selenium
Selenium
78%
5.1%
25%
64%
45%
51%
121%
78%
64%
0%
4
100 g
300 g
1 tbsp - 8.5g 1 large - 50g 1 cup, chopped - 136g
Magnesium
Magnesium
Calcium
Calcium
Potassium
Potassium
Iron
Iron
Copper
Copper
Zinc
Zinc
Phosphorus
Phosphorus
Sodium
Sodium
Manganese
Manganese
Selenium
Selenium
7.1%
15%
11%
45%
667%
29%
74%
16%
3.4%
168%
Vitamin Comparison
Vitamin comparison score is based on the number of vitamins by which one or the other food is richer. The "coverage" charts below show how much of the daily needs can be covered by 300 grams of the food.
4
100 g
300 g
1 oz - 28.35g 2 oz - 57g
Vitamin C
Vit. C
Vitamin D
Vit. D
Vitamin A
Vit. A
Vitamin E
Vit. E
Vitamin B1
Vit. B1
Vitamin B2
Vit. B2
Vitamin B3
Vit. B3
Vitamin B5
Vit. B5
Vitamin B6
Vit. B6
Vitamin B12
Vit. B12
Vitamin K
Vit. K
Folate
Folate
1.3%
0%
5.7%
0%
88%
33%
28%
22%
43%
0%
0%
0%
8
100 g
300 g
1 tbsp - 8.5g 1 large - 50g 1 cup, chopped - 136g
Vitamin C
Vit. C
Vitamin D
Vit. D
Vitamin A
Vit. A
Vitamin E
Vit. E
Vitamin B1
Vit. B1
Vitamin B2
Vit. B2
Vitamin B3
Vit. B3
Vitamin B5
Vit. B5
Vitamin B6
Vit. B6
Vitamin B12
Vit. B12
Vitamin K
Vit. K
Folate
Folate
0%
33%
50%
21%
17%
118%
1.2%
84%
28%
139%
0.75%
33%
All nutrients comparison - raw data values
Nutrient
DV% diff.
Copper
0.136mg
2mg
207%
Cholesterol
0mg
373mg
124%
Selenium
30.8µg
56%
Choline
293.8mg
53%
Vitamin B12
0µg
1.11µg
46%
Fiber
8.4g
0g
34%
Vitamin B2
0.142mg
0.513mg
29%
Carbs
71.7g
1.12g
24%
Magnesium
109mg
10mg
24%
Vitamin B1
0.35mg
0.066mg
24%
Sodium
600mg
124mg
21%
Manganese
0.487mg
0.026mg
20%
Vitamin B5
0.374mg
1.398mg
20%
Phosphorus
283mg
172mg
16%
Vitamin A
17µg
149µg
15%
Calories
436kcal
155kcal
14%
Polyunsaturated fat
3.22g
1.414g
12%
Vitamin D*
87 IU
11%
Vitamin D
2.2µg
11%
Folate
0µg
44µg
11%
Vitamin B3
1.507mg
0.064mg
9%
Zinc
1.88mg
1.05mg
8%
Monounsaturated fat
7.36g
4.077g
8%
Protein
9g
12.58g
7%
Vitamin E
1.03mg
7%
Fats
14.3g
10.61g
6%
Iron
1.7mg
1.19mg
6%
Potassium
286mg
126mg
5%
Vitamin B6
0.187mg
0.121mg
5%
Calcium
17mg
50mg
3%
Saturated fat
2.58g
3.267g
3%
Protein per 100 calories
2.1g
8.1g
N/A
Calories per 10 g protein
484kcal
123kcal
N/A
Weight per 100 calories
23g
65g
N/A
Unsaturated / Saturated Fat ratio
4.1
1.7
N/A
Vitamin C
0.4mg
0mg
0%
Net carbs
63.3g
1.12g
N/A
Sugar
1.12g
N/A
Vitamin K
0.3µg
0%
Tryptophan
0.153mg
0%
Threonine
0.604mg
0%
Isoleucine
0.686mg
0%
Leucine
1.075mg
0%
Lysine
0.904mg
0%
Methionine
0.392mg
0%
Phenylalanine
0.668mg
0%
Valine
0.767mg
0%
Histidine
0.298mg
0%
Omega-3 - EPA
0.005g
N/A
Omega-3 - DHA
0.038g
N/A
Macronutrient Comparison
Macronutrient breakdown side-by-side comparison
3
9%
14%
72%
3%
Protein:
9 g
Fats:
14.3 g
Carbs:
71.7 g
Water:
1.6 g
Other:
3.4 g
2
13%
11%
75%
Protein:
12.58 g
Fats:
10.61 g
Carbs:
1.12 g
Water:
74.62 g
Other:
1.07 g
Contains
more
Fats Fats
+34.8%
Contains
more
Carbs Carbs
+6301.8%
Contains
more
Other Other
+217.8%
Contains
more
Protein Protein
+39.8%
Contains
more
Water Water
+4563.8%
Fat Type Comparison
Fat type breakdown side-by-side comparison
3
20%
56%
24%
Saturated fat:
Sat. Fat
2.58 g
Monounsaturated fat:
Mono. Fat
7.36 g
Polyunsaturated fat:
Poly. Fat
3.22 g
0
37%
47%
16%
Saturated fat:
Sat. Fat
3.267 g
Monounsaturated fat:
Mono. Fat
4.077 g
Polyunsaturated fat:
Poly. Fat
1.414 g
Contains
less
Sat. Fat Saturated fat
-21%
Contains
more
Mono. Fat Monounsaturated fat
+80.5%
Contains
more
Poly. Fat Polyunsaturated fat
+127.7%