The main differences between crab meat and roe Crab meat is richer in copper and zinc, yet roe is richer in vitamin B2, phosphorus, selenium, vitamin B1, vitamin B5, and folate. Daily need coverage for cholesterol for roe is 142% higher. Crab meat contains 9 times more copper than roe. Crab meat contains 1.182mg of copper, while roe contains 0.128mg. Roe contains less sodium. Crab meat has a lower glycemic index than roe. Food types used in this article are Crustaceans, crab, alaska king, cooked, moist heat and Fish, roe, mixed species, cooked, dry heat .
Infographic
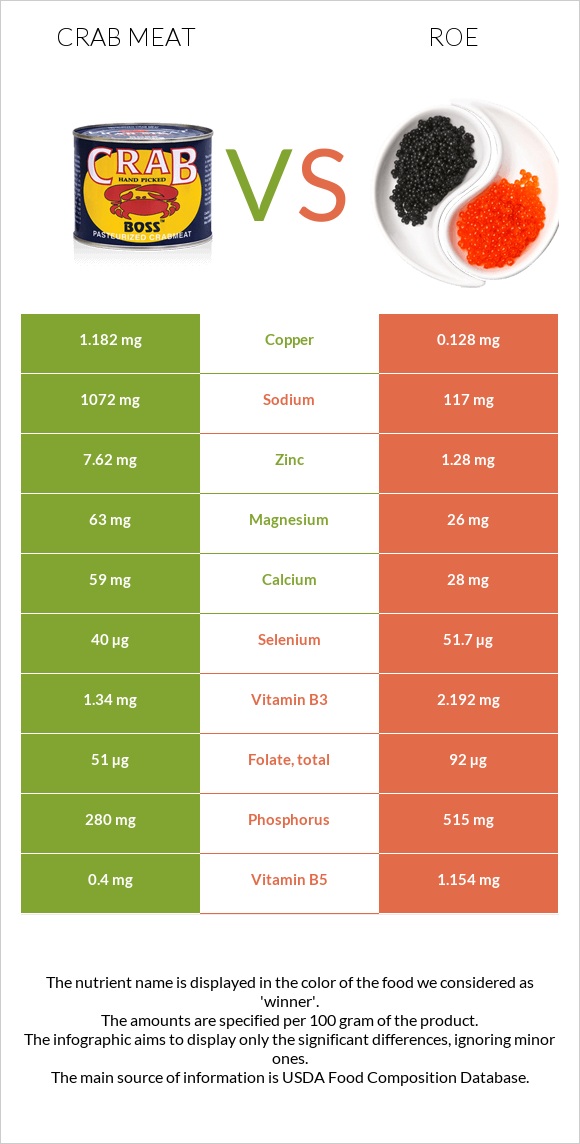
Mineral Comparison
Mineral comparison score is based on the number of minerals by which one or the other food is richer. The "coverage" charts below show how much of the daily needs can be covered by 300 grams of the food.
5
100 g
300 g
3 oz - 85g 1 leg - 134g
Magnesium
Magnesium
Calcium
Calcium
Potassium
Potassium
Iron
Iron
Copper
Copper
Zinc
Zinc
Phosphorus
Phosphorus
Sodium
Sodium
Manganese
Manganese
Selenium
Selenium
45%
18%
23%
29%
394%
208%
120%
140%
5.2%
218%
3
100 g
300 g
1 oz - 28.35g 3 oz - 85g
Magnesium
Magnesium
Calcium
Calcium
Potassium
Potassium
Iron
Iron
Copper
Copper
Zinc
Zinc
Phosphorus
Phosphorus
Sodium
Sodium
Manganese
Manganese
Selenium
Selenium
19%
8.4%
25%
29%
43%
35%
221%
15%
1.7%
282%
Vitamin Comparison
Vitamin comparison score is based on the number of vitamins by which one or the other food is richer. The "coverage" charts below show how much of the daily needs can be covered by 300 grams of the food.
0
100 g
300 g
3 oz - 85g 1 leg - 134g
Vitamin C
Vit. C
Vitamin D
Vit. D
Vitamin A
Vit. A
Vitamin E
Vit. E
Vitamin B1
Vit. B1
Vitamin B2
Vit. B2
Vitamin B3
Vit. B3
Vitamin B5
Vit. B5
Vitamin B6
Vit. B6
Vitamin B12
Vit. B12
Vitamin K
Vit. K
Folate
Folate
25%
0%
3%
0%
13%
13%
25%
24%
42%
1438%
0%
38%
7
100 g
300 g
1 oz - 28.35g 3 oz - 85g
Vitamin C
Vit. C
Vitamin D
Vit. D
Vitamin A
Vit. A
Vitamin E
Vit. E
Vitamin B1
Vit. B1
Vitamin B2
Vit. B2
Vitamin B3
Vit. B3
Vitamin B5
Vit. B5
Vitamin B6
Vit. B6
Vitamin B12
Vit. B12
Vitamin K
Vit. K
Folate
Folate
55%
0%
30%
0%
69%
219%
41%
69%
43%
1443%
0%
69%
All nutrients comparison - raw data values
Nutrient
DV% diff.
Cholesterol
53mg
479mg
142%
Copper
1.182mg
0.128mg
117%
Vitamin B2
0.055mg
0.949mg
69%
Zinc
7.62mg
1.28mg
58%
Sodium
1072mg
117mg
42%
Phosphorus
280mg
515mg
34%
Selenium
40µg
51.7µg
21%
Protein
19.35g
28.62g
19%
Vitamin B1
0.053mg
0.277mg
19%
Polyunsaturated fat
0.536g
3.404g
19%
Vitamin B5
0.4mg
1.154mg
15%
Fats
1.54g
8.23g
10%
Vitamin C
7.6mg
16.4mg
10%
Folate
51µg
92µg
10%
Magnesium
63mg
26mg
9%
Vitamin A
9µg
91µg
9%
Saturated fat
0.133g
1.866g
8%
Calories
97kcal
204kcal
5%
Vitamin B3
1.34mg
2.192mg
5%
Monounsaturated fat
0.185g
2.129g
5%
Calcium
59mg
28mg
3%
Vitamin B12
11.5µg
11.54µg
2%
Carbs
0g
1.92g
1%
Potassium
262mg
283mg
1%
Manganese
0.04mg
0.013mg
1%
Protein per 100 calories
20g
14g
N/A
Calories per 10 g protein
50kcal
71kcal
N/A
Weight per 100 calories
103g
49g
N/A
Unsaturated / Saturated Fat ratio
5.4
3
N/A
Net carbs
0g
1.92g
N/A
Iron
0.76mg
0.77mg
0%
Vitamin B6
0.18mg
0.185mg
0%
Tryptophan
0.269mg
0.375mg
0%
Threonine
0.783mg
1.305mg
0%
Isoleucine
0.938mg
1.465mg
0%
Leucine
1.536mg
2.509mg
0%
Lysine
1.684mg
2.179mg
0%
Methionine
0.545mg
0.71mg
0%
Phenylalanine
0.817mg
1.401mg
0%
Valine
0.91mg
1.676mg
0%
Histidine
0.393mg
0.778mg
0%
Omega-3 - EPA
0.295g
1.26g
N/A
Omega-3 - DHA
0.118g
1.747g
N/A
Omega-3 - DPA
0.031g
0.105g
N/A
Macronutrient Comparison
Macronutrient breakdown side-by-side comparison
1
19%
78%
Protein:
19.35 g
Fats:
1.54 g
Carbs:
0 g
Water:
77.55 g
Other:
1.56 g
4
29%
8%
2%
59%
3%
Protein:
28.62 g
Fats:
8.23 g
Carbs:
1.92 g
Water:
58.63 g
Other:
2.6 g
Contains
more
Water Water
+32.3%
Contains
more
Protein Protein
+47.9%
Contains
more
Fats Fats
+434.4%
Contains
more
Carbs Carbs
+∞%
Contains
more
Other Other
+66.7%
Fat Type Comparison
Fat type breakdown side-by-side comparison
1
16%
22%
63%
Saturated fat:
Sat. Fat
0.133 g
Monounsaturated fat:
Mono. Fat
0.185 g
Polyunsaturated fat:
Poly. Fat
0.536 g
2
25%
29%
46%
Saturated fat:
Sat. Fat
1.866 g
Monounsaturated fat:
Mono. Fat
2.129 g
Polyunsaturated fat:
Poly. Fat
3.404 g
Contains
less
Sat. Fat Saturated fat
-92.9%
Contains
more
Mono. Fat Monounsaturated fat
+1050.8%
Contains
more
Poly. Fat Polyunsaturated fat
+535.1%