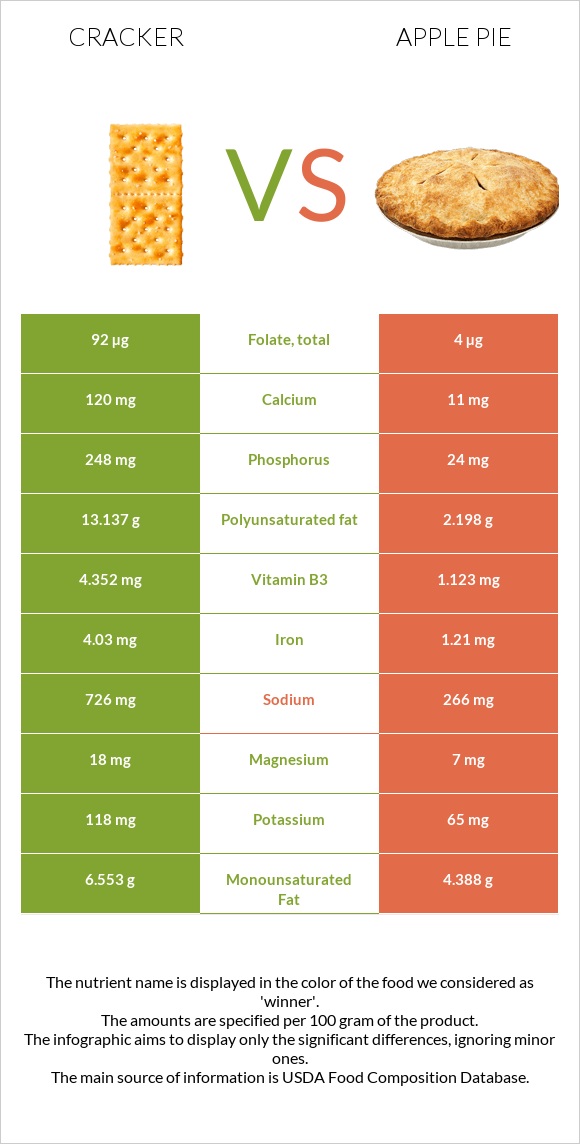
Important differences between crackers and apple pie Apple pie has less iron, phosphorus, vitamin B1, vitamin B2, folate, vitamin B3, manganese, and calcium. Crackers' daily need coverage for iron is 35% more. Crackers have 23 times more folate than apple pie. Crackers have 92µg of folate, while apple pie has 4µg. Apple pie is lower in sodium. Crackers have a higher glycemic index than apple pie. The food varieties used in the comparison are Crackers, standard snack-type, regular and Pie, apple, commercially prepared, unenriched flour .
Infographic
Mineral Comparison
Mineral comparison score is based on the number of minerals by which one or the other food is richer. The "coverage" charts below show how much of the daily needs can be covered by 300 grams of the food.
9
100 g
300 g
1 cracker, round - 3.2g 1 cracker, rectangular - 4g 5 crackers - 16g 5 crackers, regular size, round (1 serving) - 16g 1 cup crushed - 52g
Magnesium
Magnesium
Calcium
Calcium
Potassium
Potassium
Iron
Iron
Copper
Copper
Zinc
Zinc
Phosphorus
Phosphorus
Sodium
Sodium
Manganese
Manganese
Selenium
Selenium
13%
36%
10%
151%
35%
13%
106%
95%
64%
37%
1
100 g
300 g
1 oz - 28.35g 1 piece (1/6 of 8" pie) - 117g 1 piece (1/8 of 9" dia) - 125g
Magnesium
Magnesium
Calcium
Calcium
Potassium
Potassium
Iron
Iron
Copper
Copper
Zinc
Zinc
Phosphorus
Phosphorus
Sodium
Sodium
Manganese
Manganese
Selenium
Selenium
5%
3.3%
5.7%
45%
15%
4.4%
10%
35%
24%
0%
Vitamin Comparison
Vitamin comparison score is based on the number of vitamins by which one or the other food is richer. The "coverage" charts below show how much of the daily needs can be covered by 300 grams of the food.
8
100 g
300 g
1 cracker, round - 3.2g 1 cracker, rectangular - 4g 5 crackers - 16g 5 crackers, regular size, round (1 serving) - 16g 1 cup crushed - 52g
Vitamin C
Vit. C
Vitamin D
Vit. D
Vitamin A
Vit. A
Vitamin E
Vit. E
Vitamin B1
Vit. B1
Vitamin B2
Vit. B2
Vitamin B3
Vit. B3
Vitamin B5
Vit. B5
Vitamin B6
Vit. B6
Vitamin B12
Vit. B12
Vitamin K
Vit. K
Folate
Folate
0%
0%
0%
61%
104%
105%
82%
25%
15%
0%
173%
69%
3
100 g
300 g
1 oz - 28.35g 1 piece (1/6 of 8" pie) - 117g 1 piece (1/8 of 9" dia) - 125g
Vitamin C
Vit. C
Vitamin D
Vit. D
Vitamin A
Vit. A
Vitamin E
Vit. E
Vitamin B1
Vit. B1
Vitamin B2
Vit. B2
Vitamin B3
Vit. B3
Vitamin B5
Vit. B5
Vitamin B6
Vit. B6
Vitamin B12
Vit. B12
Vitamin K
Vit. K
Folate
Folate
11%
0%
9.7%
0%
34%
36%
21%
7.1%
8.8%
1.3%
0%
3%
All nutrients comparison - raw data values
Nutrient
DV% diff.
Polyunsaturated fat
13.137g
2.198g
73%
Vitamin K
69.3µg
58%
Iron
4.03mg
1.21mg
35%
Phosphorus
248mg
24mg
32%
Fats
26.43g
11g
24%
Vitamin B1
0.416mg
0.134mg
24%
Vitamin B2
0.456mg
0.158mg
23%
Folate
92µg
4µg
22%
Starch
49.69g
20%
Sodium
726mg
266mg
20%
Vitamin E
3.03mg
20%
Vitamin B3
4.352mg
1.123mg
20%
Calories
510kcal
237kcal
14%
Manganese
0.491mg
0.182mg
13%
Selenium
6.7µg
12%
Calcium
120mg
11mg
11%
Protein
6.64g
1.9g
9%
Carbs
61.3g
34g
9%
Saturated fat
5.562g
3.797g
8%
Copper
0.104mg
0.046mg
6%
Vitamin B5
0.417mg
0.119mg
6%
Monounsaturated fat
6.553g
4.388g
5%
Vitamin C
0mg
3.2mg
4%
Magnesium
18mg
7mg
3%
Fiber
2.3g
1.6g
3%
Zinc
0.49mg
0.16mg
3%
Vitamin A
0µg
29µg
3%
Potassium
118mg
65mg
2%
Vitamin B6
0.063mg
0.038mg
2%
Choline
9.6mg
2%
Protein per 100 calories
1.3g
0.8g
N/A
Calories per 10 g protein
768kcal
1247kcal
N/A
Weight per 100 calories
20g
42g
N/A
Unsaturated / Saturated Fat ratio
3.5
1.7
N/A
Net carbs
59g
32.4g
N/A
Sugar
8.18g
N/A
Vitamin B12
0µg
0.01µg
0%
Trans fat
1.076g
N/A
Tryptophan
0.084mg
0.026mg
0%
Threonine
0.193mg
0.054mg
0%
Isoleucine
0.246mg
0.073mg
0%
Leucine
0.471mg
0.129mg
0%
Lysine
0.103mg
0.07mg
0%
Methionine
0.112mg
0.032mg
0%
Phenylalanine
0.331mg
0.088mg
0%
Valine
0.294mg
0.084mg
0%
Histidine
0.145mg
0.038mg
0%
Fructose
0.29g
0%
Omega-3 - ALA
1.485g
N/A
Omega-6 - Gamma-linoleic acid
0.062g
N/A
Omega-6 - Eicosadienoic acid
0.009g
N/A
Omega-6 - Linoleic acid
11.48g
N/A
Macronutrient Comparison
Macronutrient breakdown side-by-side comparison
4
7%
26%
61%
3%
2%
Protein:
6.64 g
Fats:
26.43 g
Carbs:
61.3 g
Water:
3.14 g
Other:
2.49 g
1
2%
11%
34%
52%
Protein:
1.9 g
Fats:
11 g
Carbs:
34 g
Water:
52.2 g
Other:
0.9 g
Contains
more
Protein Protein
+249.5%
Contains
more
Fats Fats
+140.3%
Contains
more
Carbs Carbs
+80.3%
Contains
more
Other Other
+176.7%
Contains
more
Water Water
+1562.4%
Fat Type Comparison
Fat type breakdown side-by-side comparison
2
22%
26%
52%
Saturated fat:
Sat. Fat
5.562 g
Monounsaturated fat:
Mono. Fat
6.553 g
Polyunsaturated fat:
Poly. Fat
13.137 g
1
37%
42%
21%
Saturated fat:
Sat. Fat
3.797 g
Monounsaturated fat:
Mono. Fat
4.388 g
Polyunsaturated fat:
Poly. Fat
2.198 g
Contains
more
Mono. Fat Monounsaturated fat
+49.3%
Contains
more
Poly. Fat Polyunsaturated fat
+497.7%
Contains
less
Sat. Fat Saturated fat
-31.7%