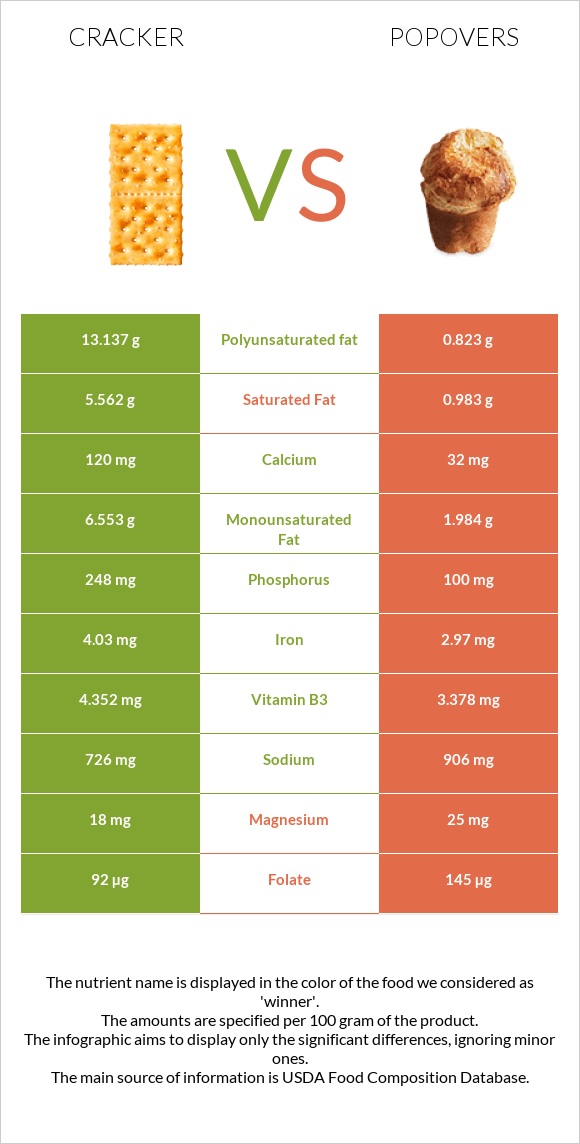
How are crackers and popovers different? Crackers have more vitamin B2, phosphorus, iron, and calcium; however, popovers are richer in selenium, folate, manganese, and copper. Popovers cover your daily need for selenium, 56% more than crackers. Crackers have 6 times more saturated fat than popovers. Crackers have 5.562g of saturated fat, while popovers have 0.983g. Crackers, standard snack-type, regular and Popovers, dry mix, enriched types were used in this article.
Infographic
Mineral Comparison
Mineral comparison score is based on the number of minerals by which one or the other food is richer. The "coverage" charts below show how much of the daily needs can be covered by 300 grams of the food.
5
100 g
300 g
1 cracker, round - 3.2g 1 cracker, rectangular - 4g 5 crackers - 16g 5 crackers, regular size, round (1 serving) - 16g 1 cup crushed - 52g
Magnesium
Magnesium
Calcium
Calcium
Potassium
Potassium
Iron
Iron
Copper
Copper
Zinc
Zinc
Phosphorus
Phosphorus
Sodium
Sodium
Manganese
Manganese
Selenium
Selenium
13%
36%
10%
151%
35%
13%
106%
95%
64%
37%
5
100 g
300 g
1 oz - 28.35g 1 package (6 oz) - 170g
Magnesium
Magnesium
Calcium
Calcium
Potassium
Potassium
Iron
Iron
Copper
Copper
Zinc
Zinc
Phosphorus
Phosphorus
Sodium
Sodium
Manganese
Manganese
Selenium
Selenium
18%
9.6%
8.8%
111%
57%
24%
43%
118%
97%
205%
Vitamin Comparison
Vitamin comparison score is based on the number of vitamins by which one or the other food is richer. The "coverage" charts below show how much of the daily needs can be covered by 300 grams of the food.
5
100 g
300 g
1 cracker, round - 3.2g 1 cracker, rectangular - 4g 5 crackers - 16g 5 crackers, regular size, round (1 serving) - 16g 1 cup crushed - 52g
Vitamin C
Vit. C
Vitamin D
Vit. D
Vitamin A
Vit. A
Vitamin E
Vit. E
Vitamin B1
Vit. B1
Vitamin B2
Vit. B2
Vitamin B3
Vit. B3
Vitamin B5
Vit. B5
Vitamin B6
Vit. B6
Vitamin B12
Vit. B12
Vitamin K
Vit. K
Folate
Folate
0%
0%
0%
61%
104%
105%
82%
25%
15%
0%
173%
69%
4
100 g
300 g
1 oz - 28.35g 1 package (6 oz) - 170g
Vitamin C
Vit. C
Vitamin D
Vit. D
Vitamin A
Vit. A
Vitamin E
Vit. E
Vitamin B1
Vit. B1
Vitamin B2
Vit. B2
Vitamin B3
Vit. B3
Vitamin B5
Vit. B5
Vitamin B6
Vit. B6
Vitamin B12
Vit. B12
Vitamin K
Vit. K
Folate
Folate
0.33%
0%
0%
0%
108%
34%
63%
29%
9.7%
10%
0%
109%
All nutrients comparison - raw data values
Nutrient
DV% diff.
Polyunsaturated fat
13.137g
0.823g
82%
Vitamin K
69.3µg
58%
Selenium
6.7µg
37.6µg
56%
Fats
26.43g
4.3g
34%
Vitamin B2
0.456mg
0.147mg
24%
Phosphorus
248mg
100mg
21%
Saturated fat
5.562g
0.983g
21%
Starch
49.69g
20%
Vitamin E
3.03mg
20%
Iron
4.03mg
2.97mg
13%
Folate
92µg
145µg
13%
Manganese
0.491mg
0.741mg
11%
Monounsaturated fat
6.553g
1.984g
11%
Calcium
120mg
32mg
9%
Fiber
2.3g
9%
Protein
6.64g
10.4g
8%
Sodium
726mg
906mg
8%
Calories
510kcal
371kcal
7%
Copper
0.104mg
0.171mg
7%
Vitamin B3
4.352mg
3.378mg
6%
Zinc
0.49mg
0.88mg
4%
Carbs
61.3g
71g
3%
Vitamin B12
0µg
0.08µg
3%
Magnesium
18mg
25mg
2%
Vitamin B6
0.063mg
0.042mg
2%
Choline
9.6mg
2%
Potassium
118mg
100mg
1%
Vitamin B1
0.416mg
0.43mg
1%
Vitamin B5
0.417mg
0.48mg
1%
Protein per 100 calories
1.3g
2.8g
N/A
Calories per 10 g protein
768kcal
357kcal
N/A
Weight per 100 calories
20g
27g
N/A
Unsaturated / Saturated Fat ratio
3.5
2.9
N/A
Vitamin C
0mg
0.1mg
0%
Net carbs
59g
71g
N/A
Sugar
8.18g
N/A
Trans fat
1.076g
N/A
Tryptophan
0.084mg
0.123mg
0%
Threonine
0.193mg
0.293mg
0%
Isoleucine
0.246mg
0.407mg
0%
Leucine
0.471mg
0.747mg
0%
Lysine
0.103mg
0.249mg
0%
Methionine
0.112mg
0.191mg
0%
Phenylalanine
0.331mg
0.517mg
0%
Valine
0.294mg
0.458mg
0%
Histidine
0.145mg
0.229mg
0%
Fructose
0.29g
0%
Omega-3 - ALA
1.485g
N/A
Omega-6 - Gamma-linoleic acid
0.062g
N/A
Omega-6 - Eicosadienoic acid
0.009g
N/A
Omega-6 - Linoleic acid
11.48g
N/A
Macronutrient Comparison
Macronutrient breakdown side-by-side comparison
1
7%
26%
61%
3%
2%
Protein:
6.64 g
Fats:
26.43 g
Carbs:
61.3 g
Water:
3.14 g
Other:
2.49 g
4
10%
4%
71%
12%
3%
Protein:
10.4 g
Fats:
4.3 g
Carbs:
71 g
Water:
11.7 g
Other:
2.6 g
Contains
more
Fats Fats
+514.7%
Contains
more
Protein Protein
+56.6%
Contains
more
Carbs Carbs
+15.8%
Contains
more
Water Water
+272.6%
Fat Type Comparison
Fat type breakdown side-by-side comparison
2
22%
26%
52%
Saturated fat:
Sat. Fat
5.562 g
Monounsaturated fat:
Mono. Fat
6.553 g
Polyunsaturated fat:
Poly. Fat
13.137 g
1
26%
52%
22%
Saturated fat:
Sat. Fat
0.983 g
Monounsaturated fat:
Mono. Fat
1.984 g
Polyunsaturated fat:
Poly. Fat
0.823 g
Contains
more
Mono. Fat Monounsaturated fat
+230.3%
Contains
more
Poly. Fat Polyunsaturated fat
+1496.2%
Contains
less
Sat. Fat Saturated fat
-82.3%