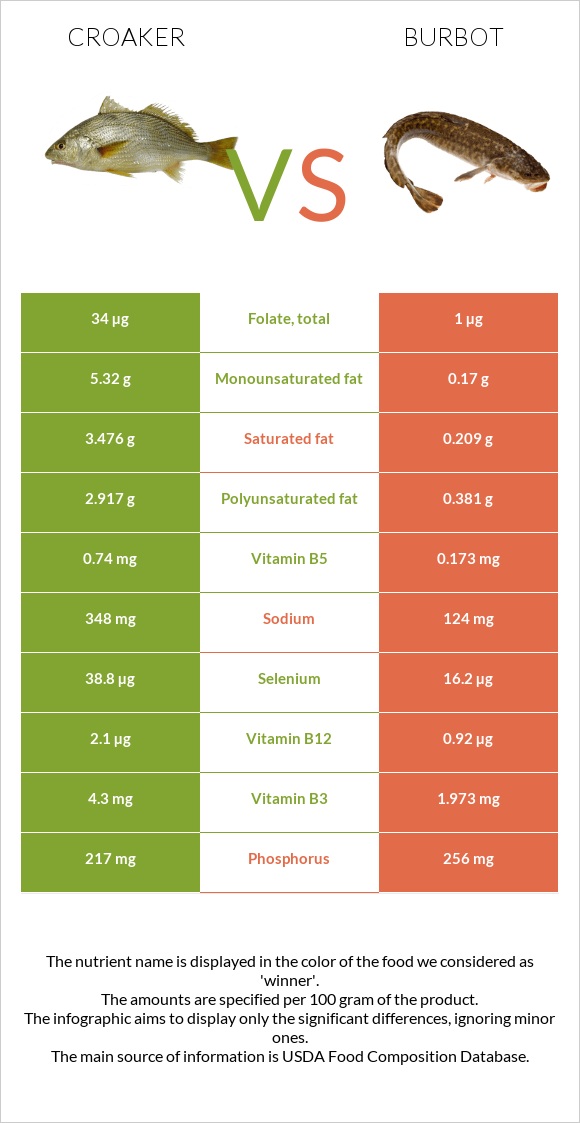
Differences between croaker and burbot Croaker is higher in vitamin B12, selenium, vitamin B3, vitamin B5, and folate; however, burbot is richer in manganese, vitamin B1, and copper. Croaker's daily need coverage for vitamin B12 is 49% higher. Croaker has 34 times more folate than burbot. While croaker has 34µg of folate, burbot has only 1µg. Burbot has less saturated fat. The food types used in this comparison are Fish, croaker, Atlantic, cooked, breaded, and fried and Fish, burbot, cooked, dry heat .
Infographic
Mineral Comparison
Mineral comparison score is based on the number of minerals by which one or the other food is richer. The "coverage" charts below show how much of the daily needs can be covered by 300 grams of the food.
1
100 g
300 g
3 oz - 85g 1 fillet - 87g
Magnesium
Magnesium
Calcium
Calcium
Potassium
Potassium
Iron
Iron
Copper
Copper
Zinc
Zinc
Phosphorus
Phosphorus
Sodium
Sodium
Manganese
Manganese
Selenium
Selenium
30%
9.6%
30%
32%
22%
14%
93%
45%
10%
212%
8
100 g
300 g
3 oz - 85g 1 fillet - 90g
Magnesium
Magnesium
Calcium
Calcium
Potassium
Potassium
Iron
Iron
Copper
Copper
Zinc
Zinc
Phosphorus
Phosphorus
Sodium
Sodium
Manganese
Manganese
Selenium
Selenium
29%
19%
46%
43%
85%
26%
110%
16%
117%
88%
Vitamin Comparison
Vitamin comparison score is based on the number of vitamins by which one or the other food is richer. The "coverage" charts below show how much of the daily needs can be covered by 300 grams of the food.
5
100 g
300 g
3 oz - 85g 1 fillet - 87g
Vitamin C
Vit. C
Vitamin D
Vit. D
Vitamin A
Vit. A
Vitamin E
Vit. E
Vitamin B1
Vit. B1
Vitamin B2
Vit. B2
Vitamin B3
Vit. B3
Vitamin B5
Vit. B5
Vitamin B6
Vit. B6
Vitamin B12
Vit. B12
Vitamin K
Vit. K
Folate
Folate
0%
0%
7.7%
0%
23%
30%
81%
44%
60%
263%
0%
26%
3
100 g
300 g
3 oz - 85g 1 fillet - 90g
Vitamin C
Vit. C
Vitamin D
Vit. D
Vitamin A
Vit. A
Vitamin E
Vit. E
Vitamin B1
Vit. B1
Vitamin B2
Vit. B2
Vitamin B3
Vit. B3
Vitamin B5
Vit. B5
Vitamin B6
Vit. B6
Vitamin B12
Vit. B12
Vitamin K
Vit. K
Folate
Folate
0%
0%
1.7%
0%
107%
40%
37%
10%
80%
115%
0%
0.75%
All nutrients comparison - raw data values
Nutrient
DV% diff.
Vitamin B12
2.1µg
0.92µg
49%
Selenium
38.8µg
16.2µg
41%
Manganese
0.08mg
0.897mg
36%
Vitamin B1
0.09mg
0.429mg
28%
Copper
0.065mg
0.256mg
21%
Fats
12.67g
1.04g
18%
Polyunsaturated fat
2.917g
0.381g
17%
Vitamin B3
4.3mg
1.973mg
15%
Saturated fat
3.476g
0.209g
15%
Protein
18.2g
24.76g
13%
Monounsaturated fat
5.32g
0.17g
13%
Vitamin B5
0.74mg
0.173mg
11%
Sodium
348mg
124mg
10%
Folate
34µg
1µg
8%
Vitamin B6
0.26mg
0.346mg
7%
Phosphorus
217mg
256mg
6%
Calories
221kcal
115kcal
5%
Potassium
340mg
518mg
5%
Iron
0.86mg
1.15mg
4%
Zinc
0.52mg
0.97mg
4%
Carbs
7.54g
0g
3%
Calcium
32mg
64mg
3%
Vitamin B2
0.13mg
0.172mg
3%
Cholesterol
84mg
77mg
2%
Fiber
0.4g
0g
2%
Vitamin A
23µg
5µg
2%
Protein per 100 calories
8.2g
22g
N/A
Calories per 10 g protein
121kcal
46kcal
N/A
Weight per 100 calories
45g
87g
N/A
Unsaturated / Saturated Fat ratio
2.4
2.6
N/A
Net carbs
7.14g
0g
N/A
Magnesium
42mg
41mg
0%
Tryptophan
0.208mg
0.277mg
0%
Threonine
0.788mg
1.085mg
0%
Isoleucine
0.847mg
1.141mg
0%
Leucine
1.48mg
2.012mg
0%
Lysine
1.571mg
2.274mg
0%
Methionine
0.525mg
0.733mg
0%
Phenylalanine
0.742mg
0.966mg
0%
Valine
0.947mg
1.275mg
0%
Histidine
0.525mg
0.729mg
0%
Omega-3 - EPA
0.113g
0.09g
N/A
Omega-3 - DHA
0.089g
0.123g
N/A
Omega-3 - DPA
0.079g
0.033g
N/A
Macronutrient Comparison
Macronutrient breakdown side-by-side comparison
3
18%
13%
8%
60%
2%
Protein:
18.2 g
Fats:
12.67 g
Carbs:
7.54 g
Water:
59.76 g
Other:
1.83 g
2
25%
73%
Protein:
24.76 g
Fats:
1.04 g
Carbs:
0 g
Water:
73.41 g
Other:
0.79 g
Contains
more
Fats Fats
+1118.3%
Contains
more
Carbs Carbs
+∞%
Contains
more
Other Other
+131.6%
Contains
more
Protein Protein
+36%
Contains
more
Water Water
+22.8%
Fat Type Comparison
Fat type breakdown side-by-side comparison
2
30%
45%
25%
Saturated fat:
Sat. Fat
3.476 g
Monounsaturated fat:
Mono. Fat
5.32 g
Polyunsaturated fat:
Poly. Fat
2.917 g
1
28%
22%
50%
Saturated fat:
Sat. Fat
0.209 g
Monounsaturated fat:
Mono. Fat
0.17 g
Polyunsaturated fat:
Poly. Fat
0.381 g
Contains
more
Mono. Fat Monounsaturated fat
+3029.4%
Contains
more
Poly. Fat Polyunsaturated fat
+665.6%
Contains
less
Sat. Fat Saturated fat
-94%